
This post was first published on August 29, 2020, on the old blog . We believe it has been useful to R users and decided to review its content and translate it into French on our new blog.
Context
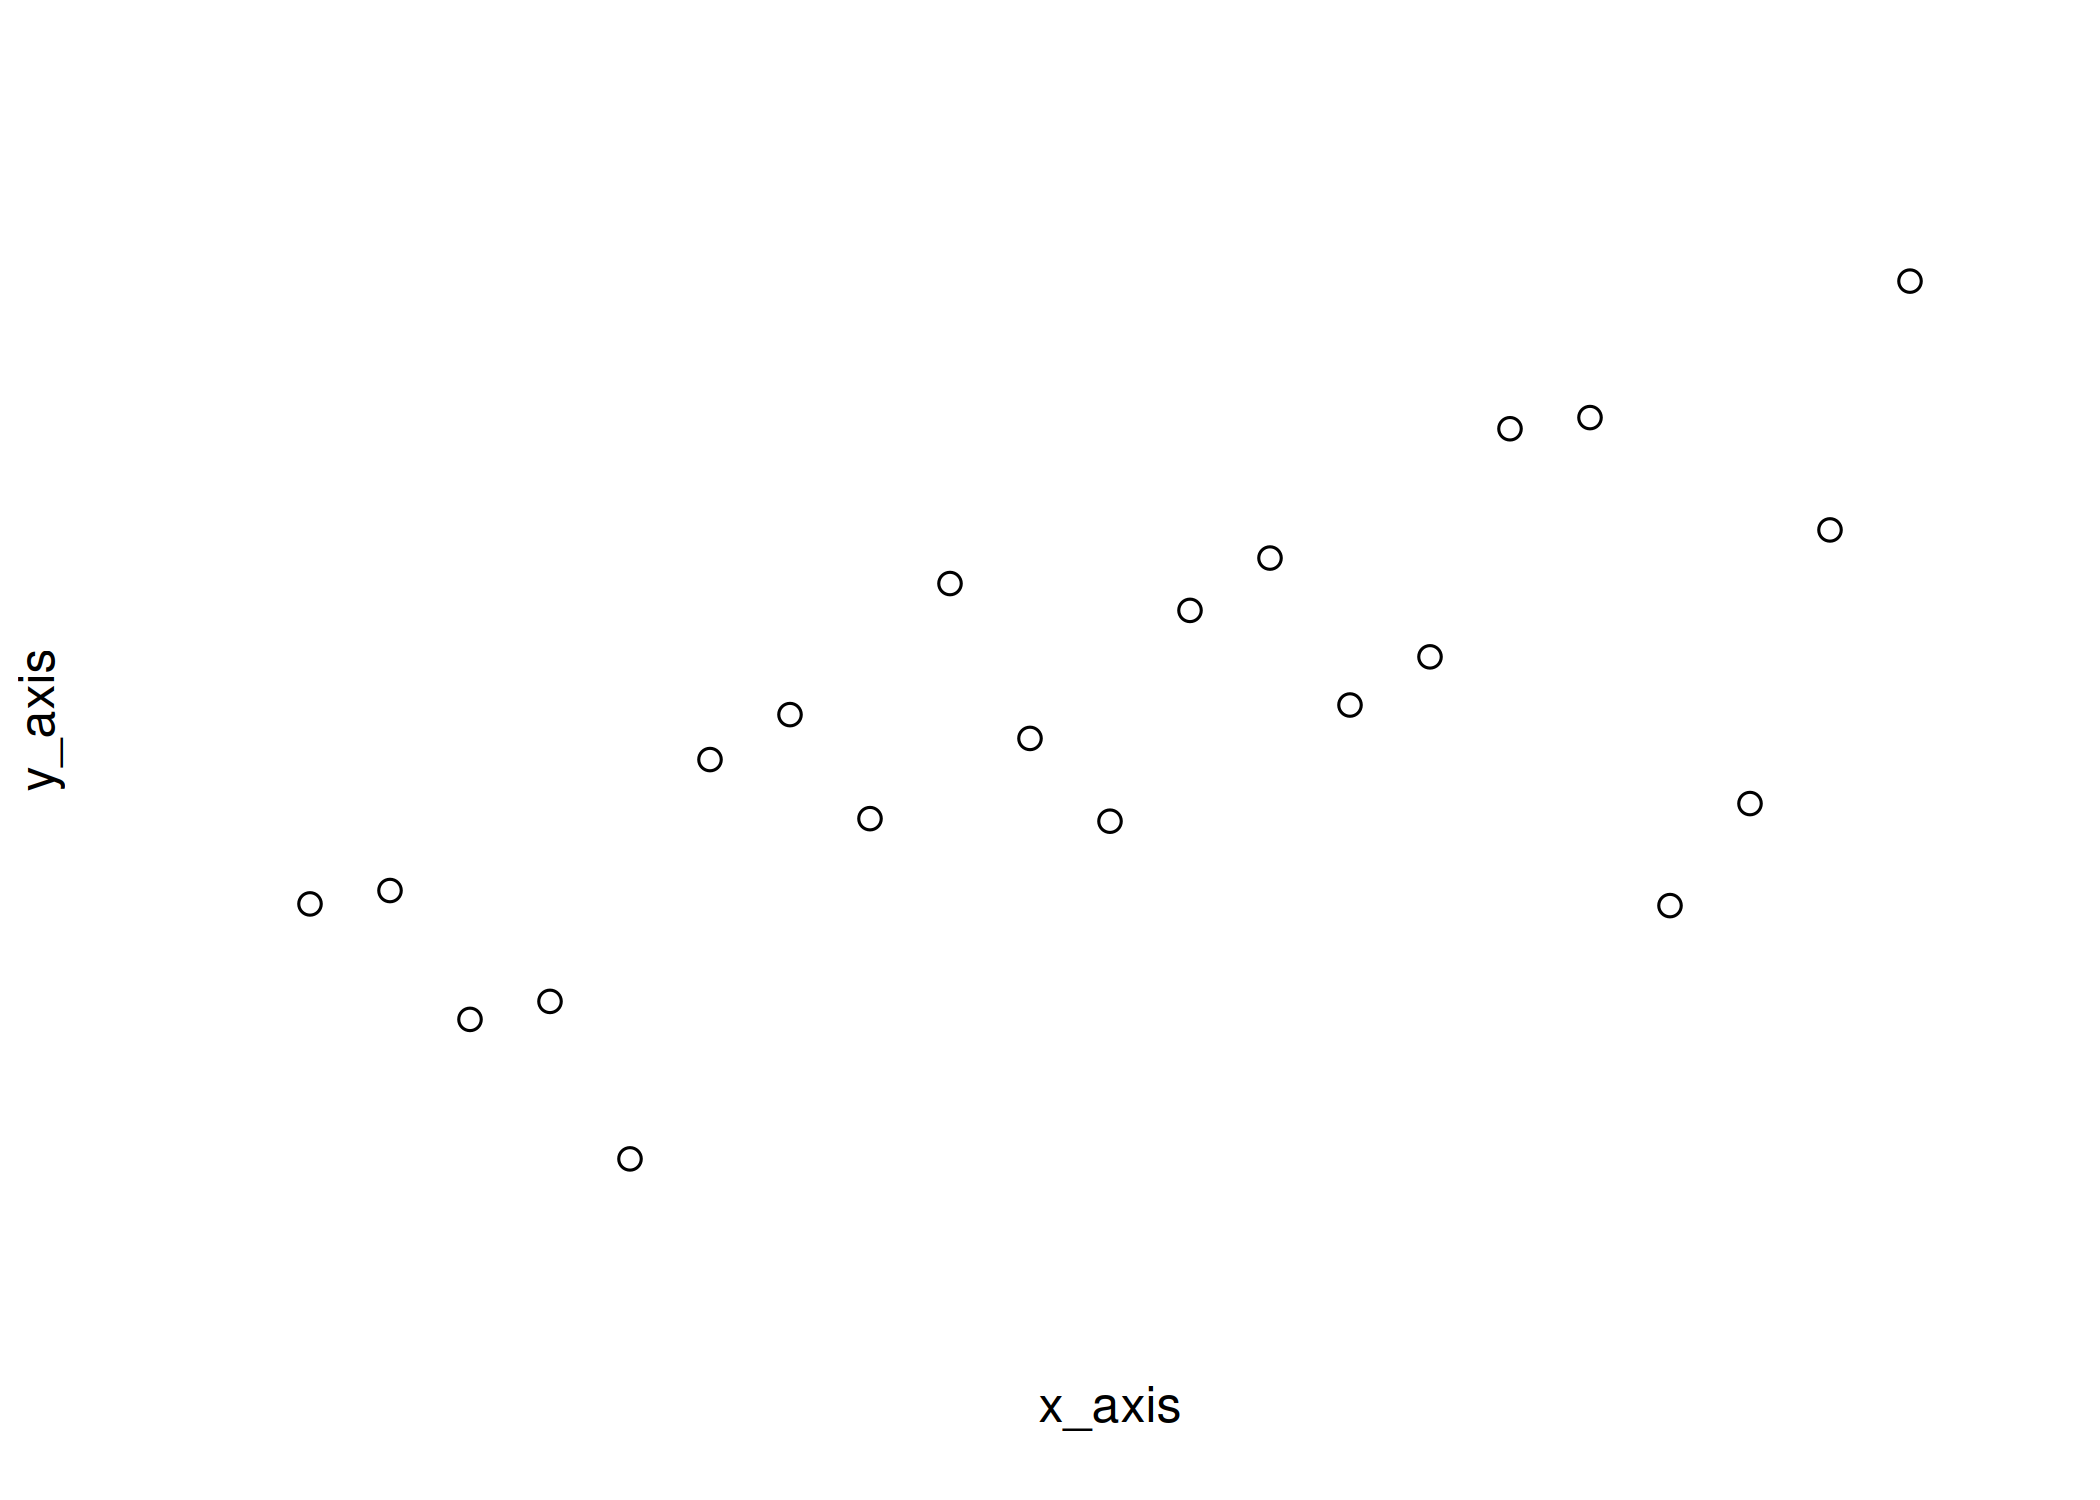
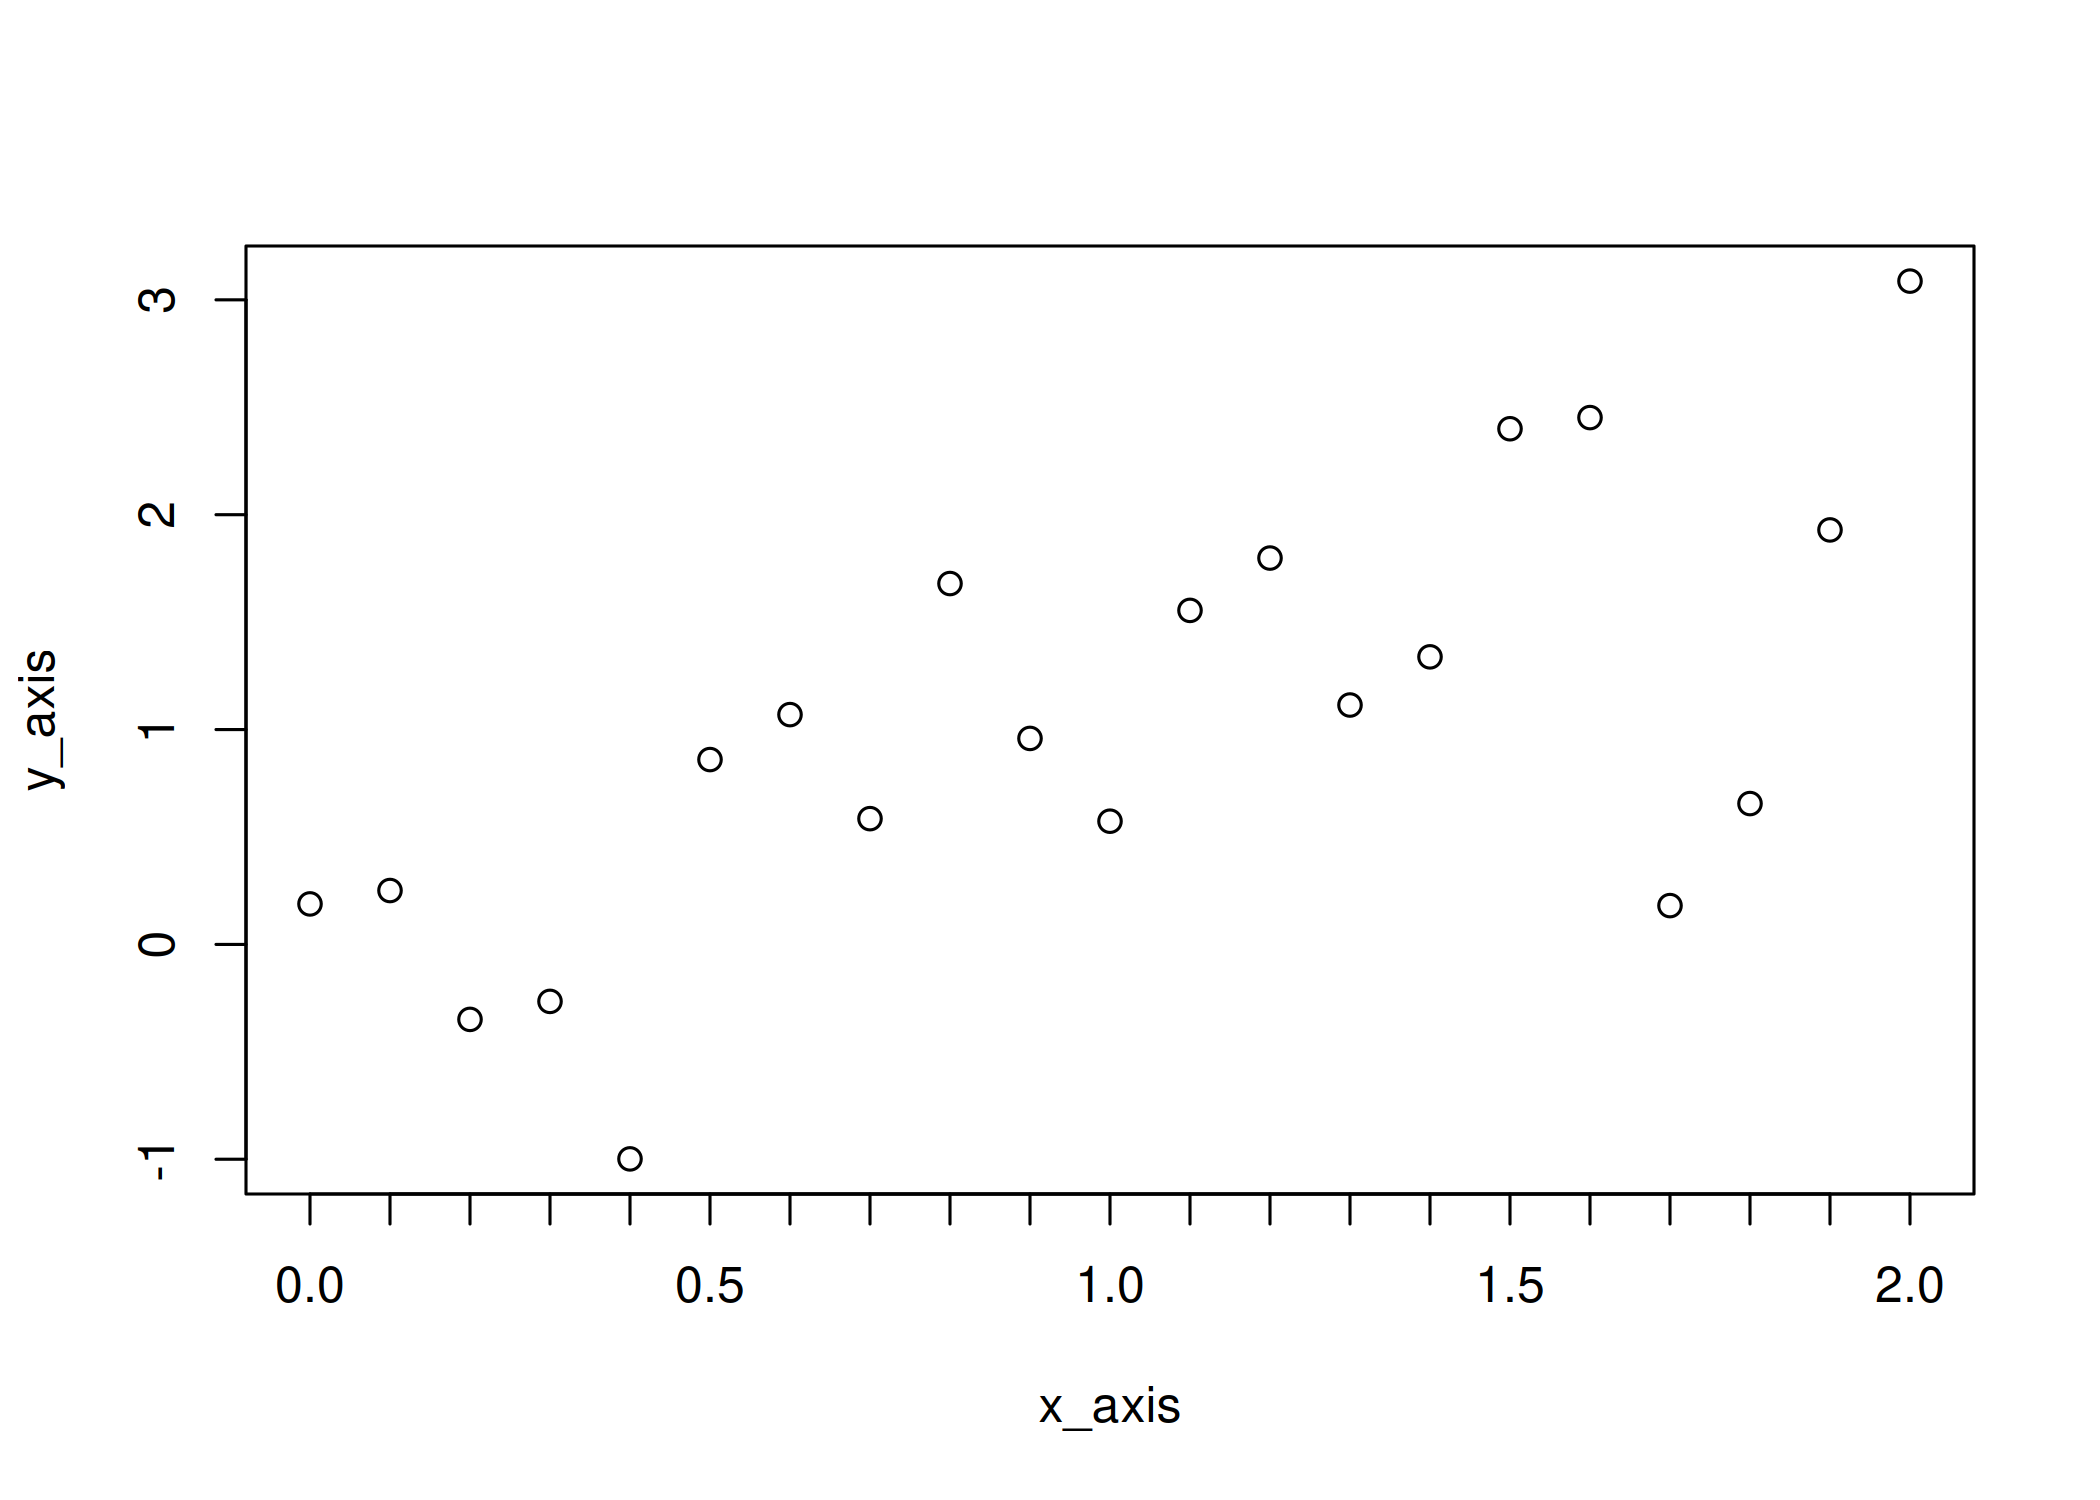
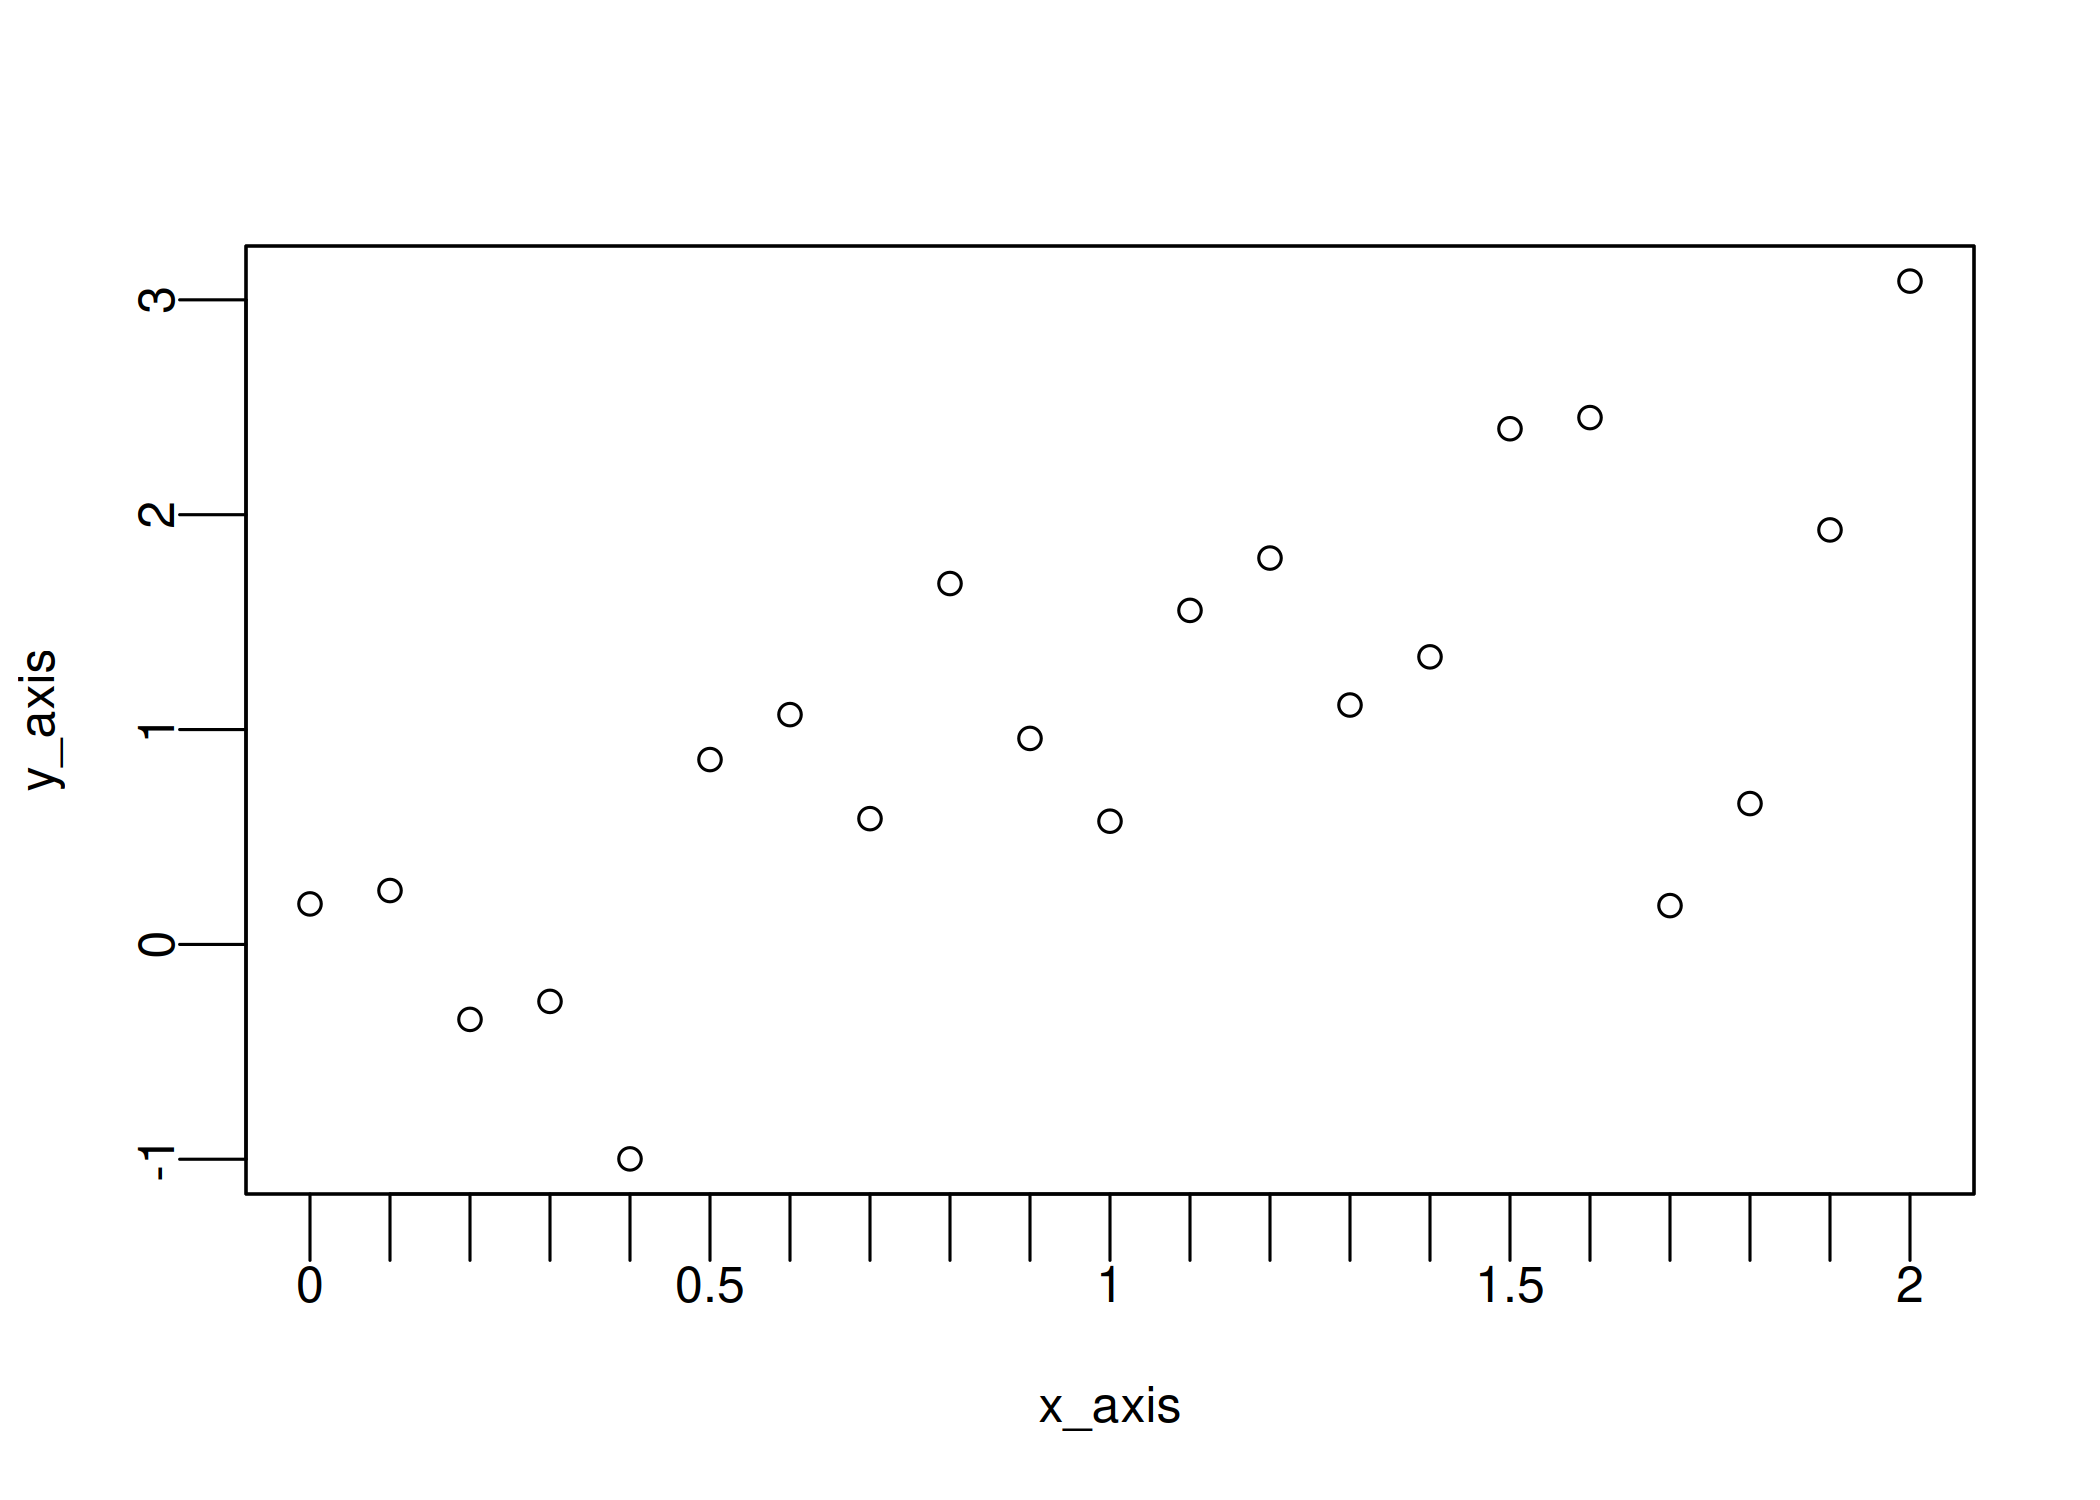
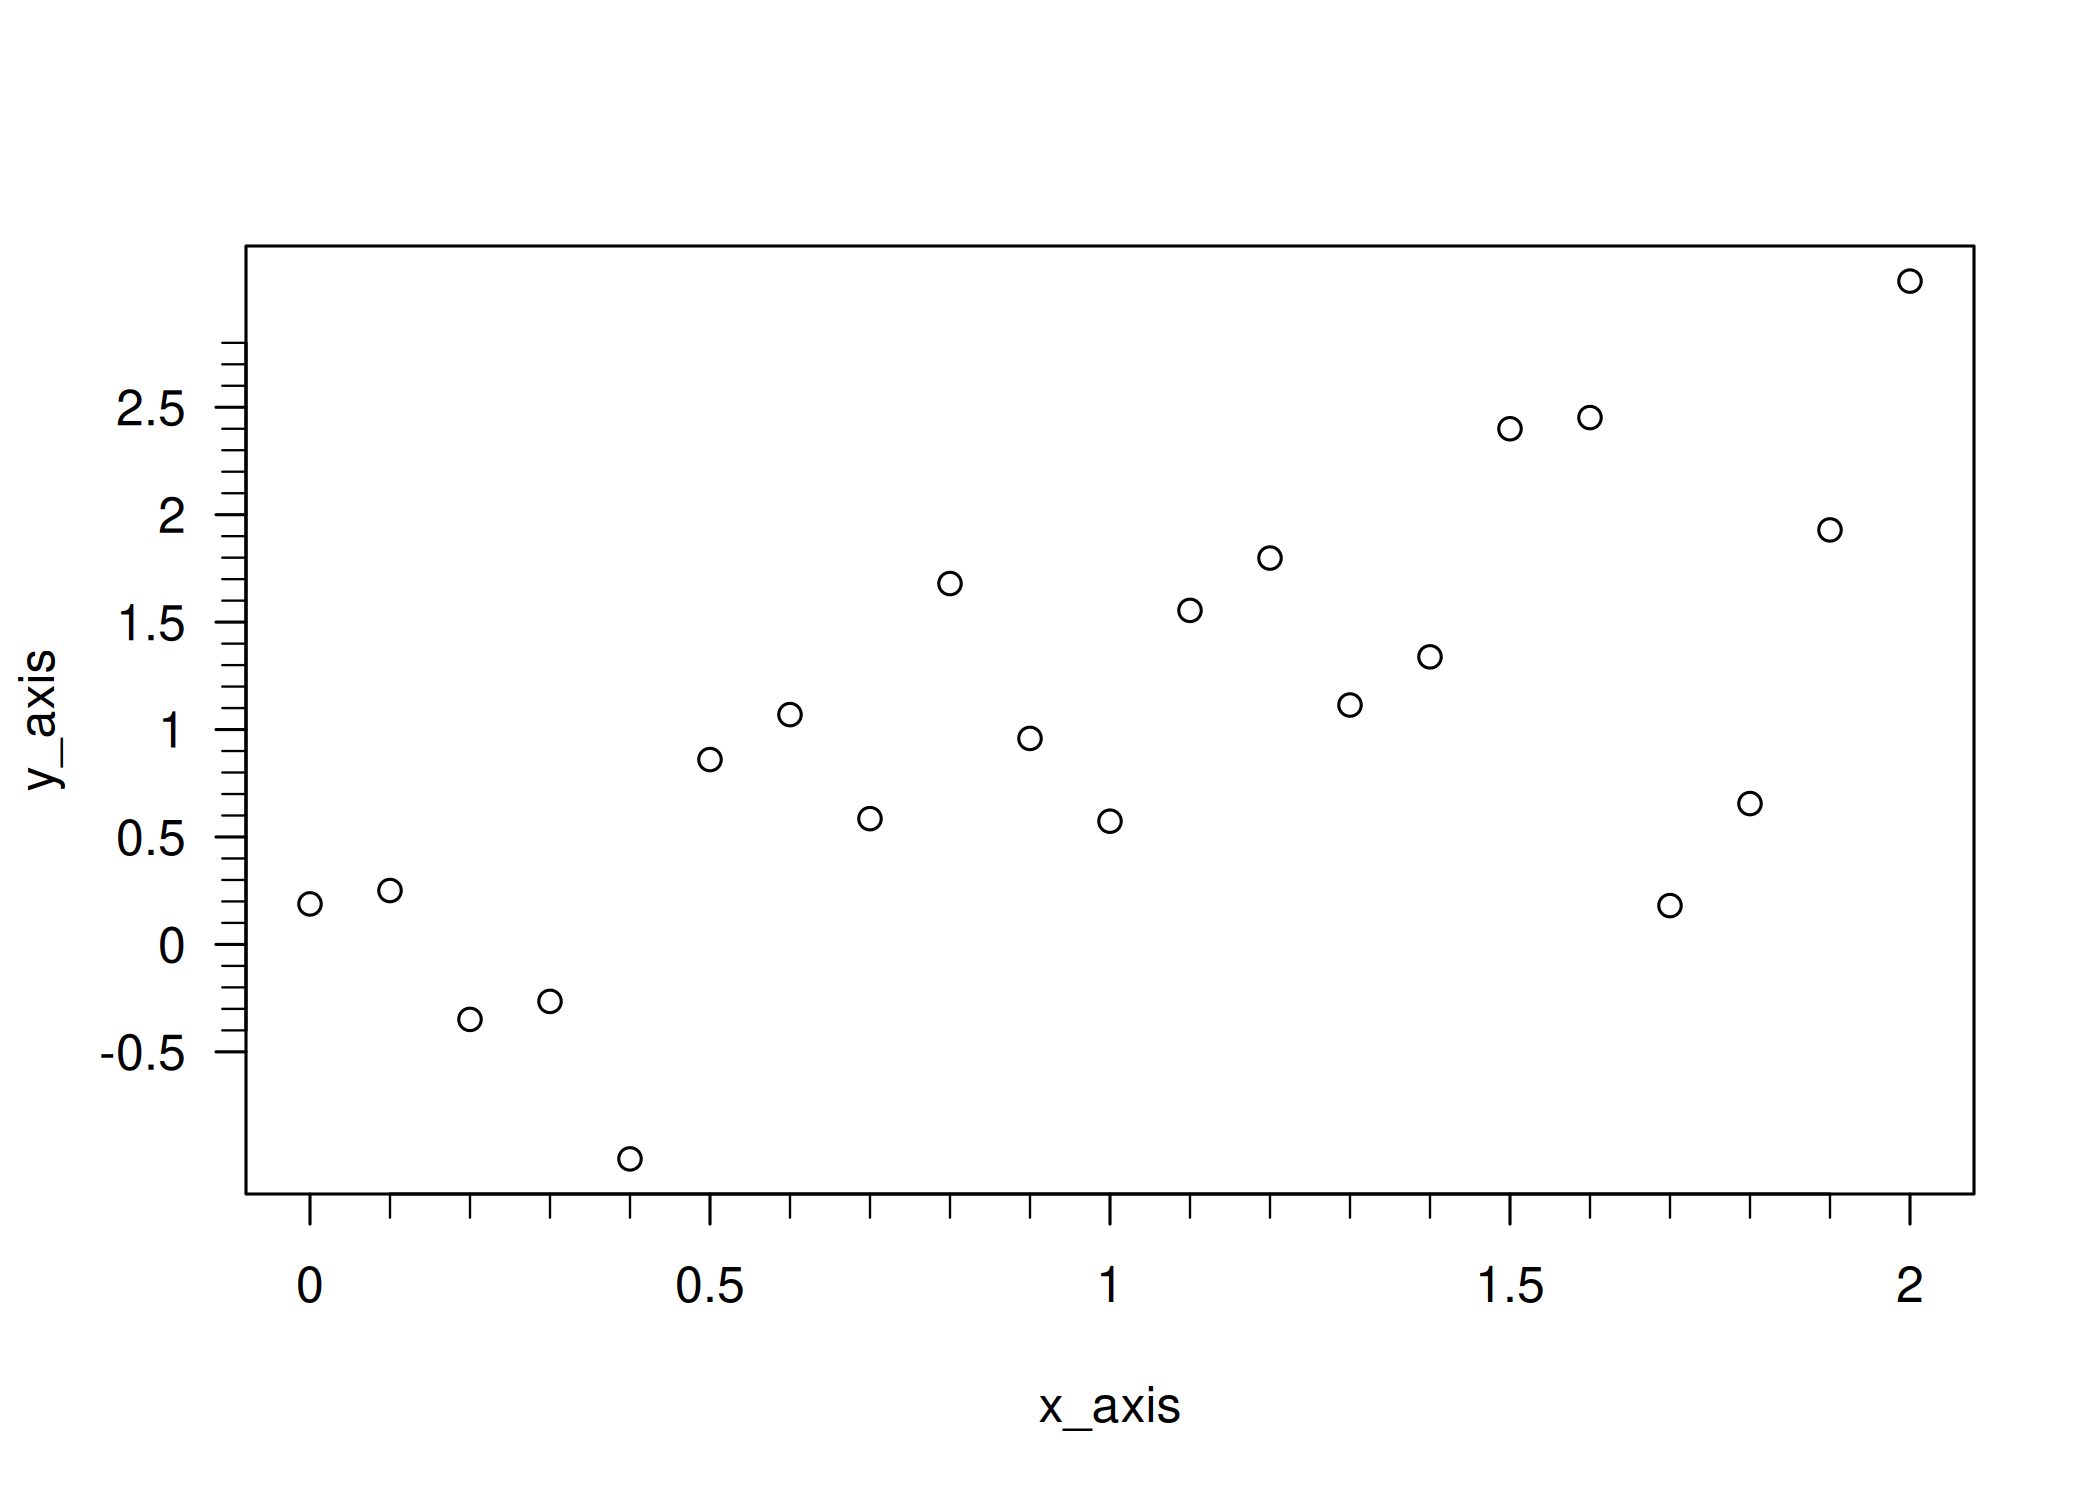
If you are using R’s base graphics system for your plots and if you like customizing them, you may have already wondered how to customize the tick marks! I do that quite a lot and I thought it would be worth explaining how I do so. Let’s consider the following plot:
| |

By default, plot.default has its own heuristics to add tick marks.
It’s a good default choice, but not always what we are looking for.
Fortunately, the core package graphics includes everything you need to customize the tick marks and so, without further ado, let’s customize our ticks!
Remove axes and add them back
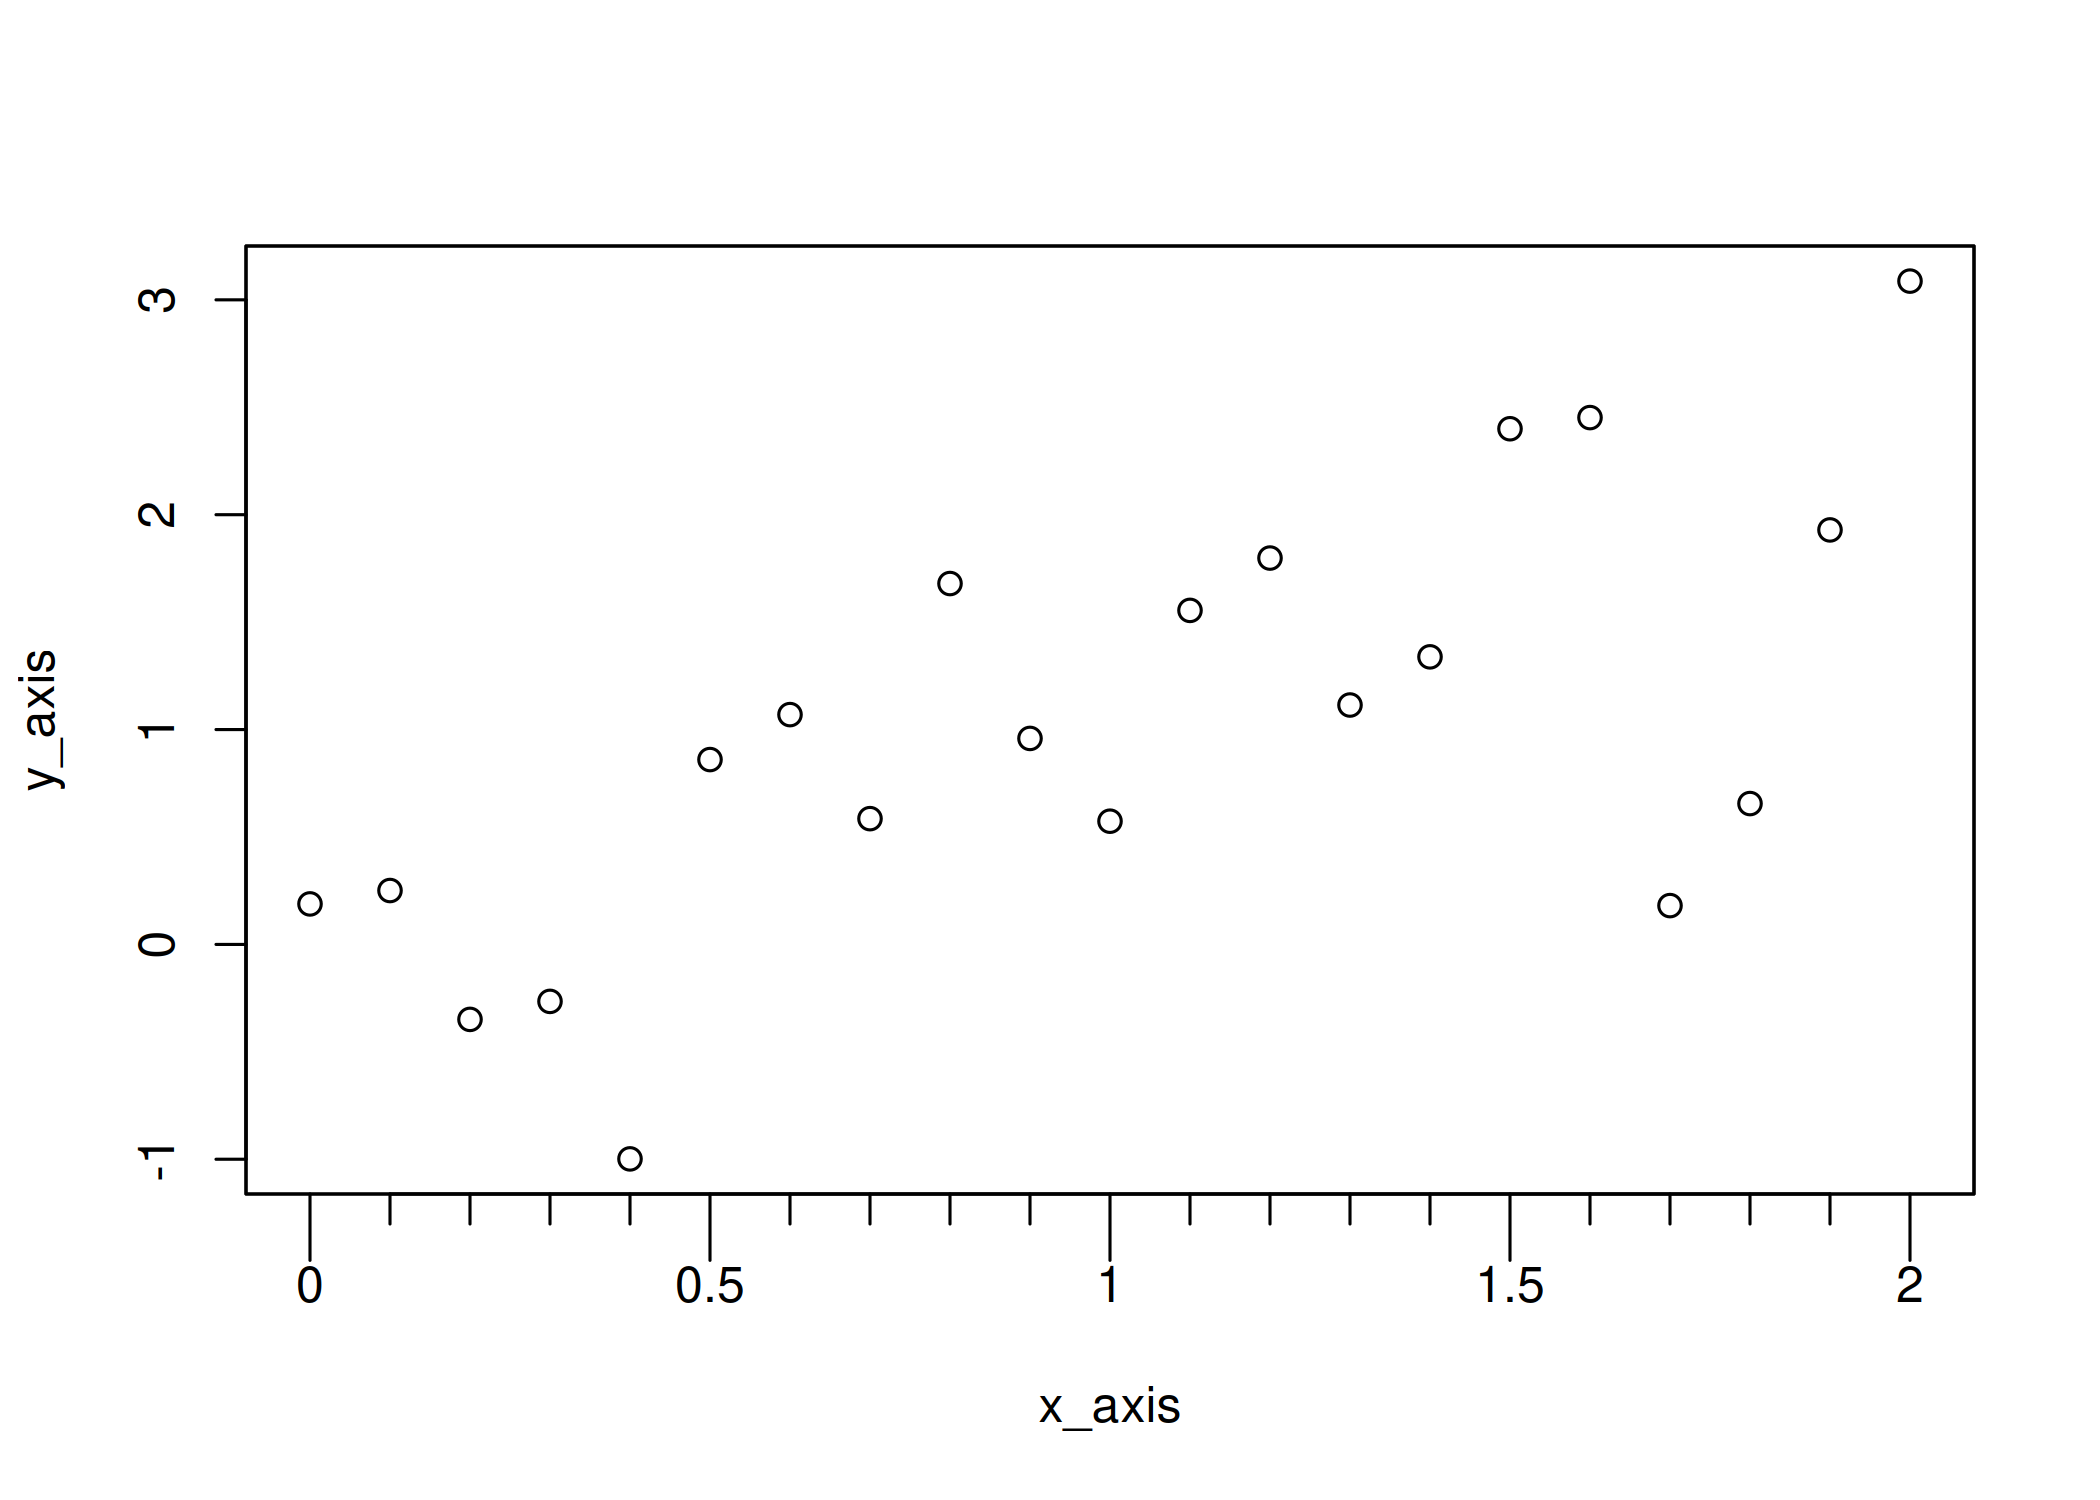
The first step is to remove all axes. There are basically two ways. One
option is to use xaxt = "n" and yaxt = "n" to selectively remove the
x-axis and the y-axis, respectively.
| |

| |

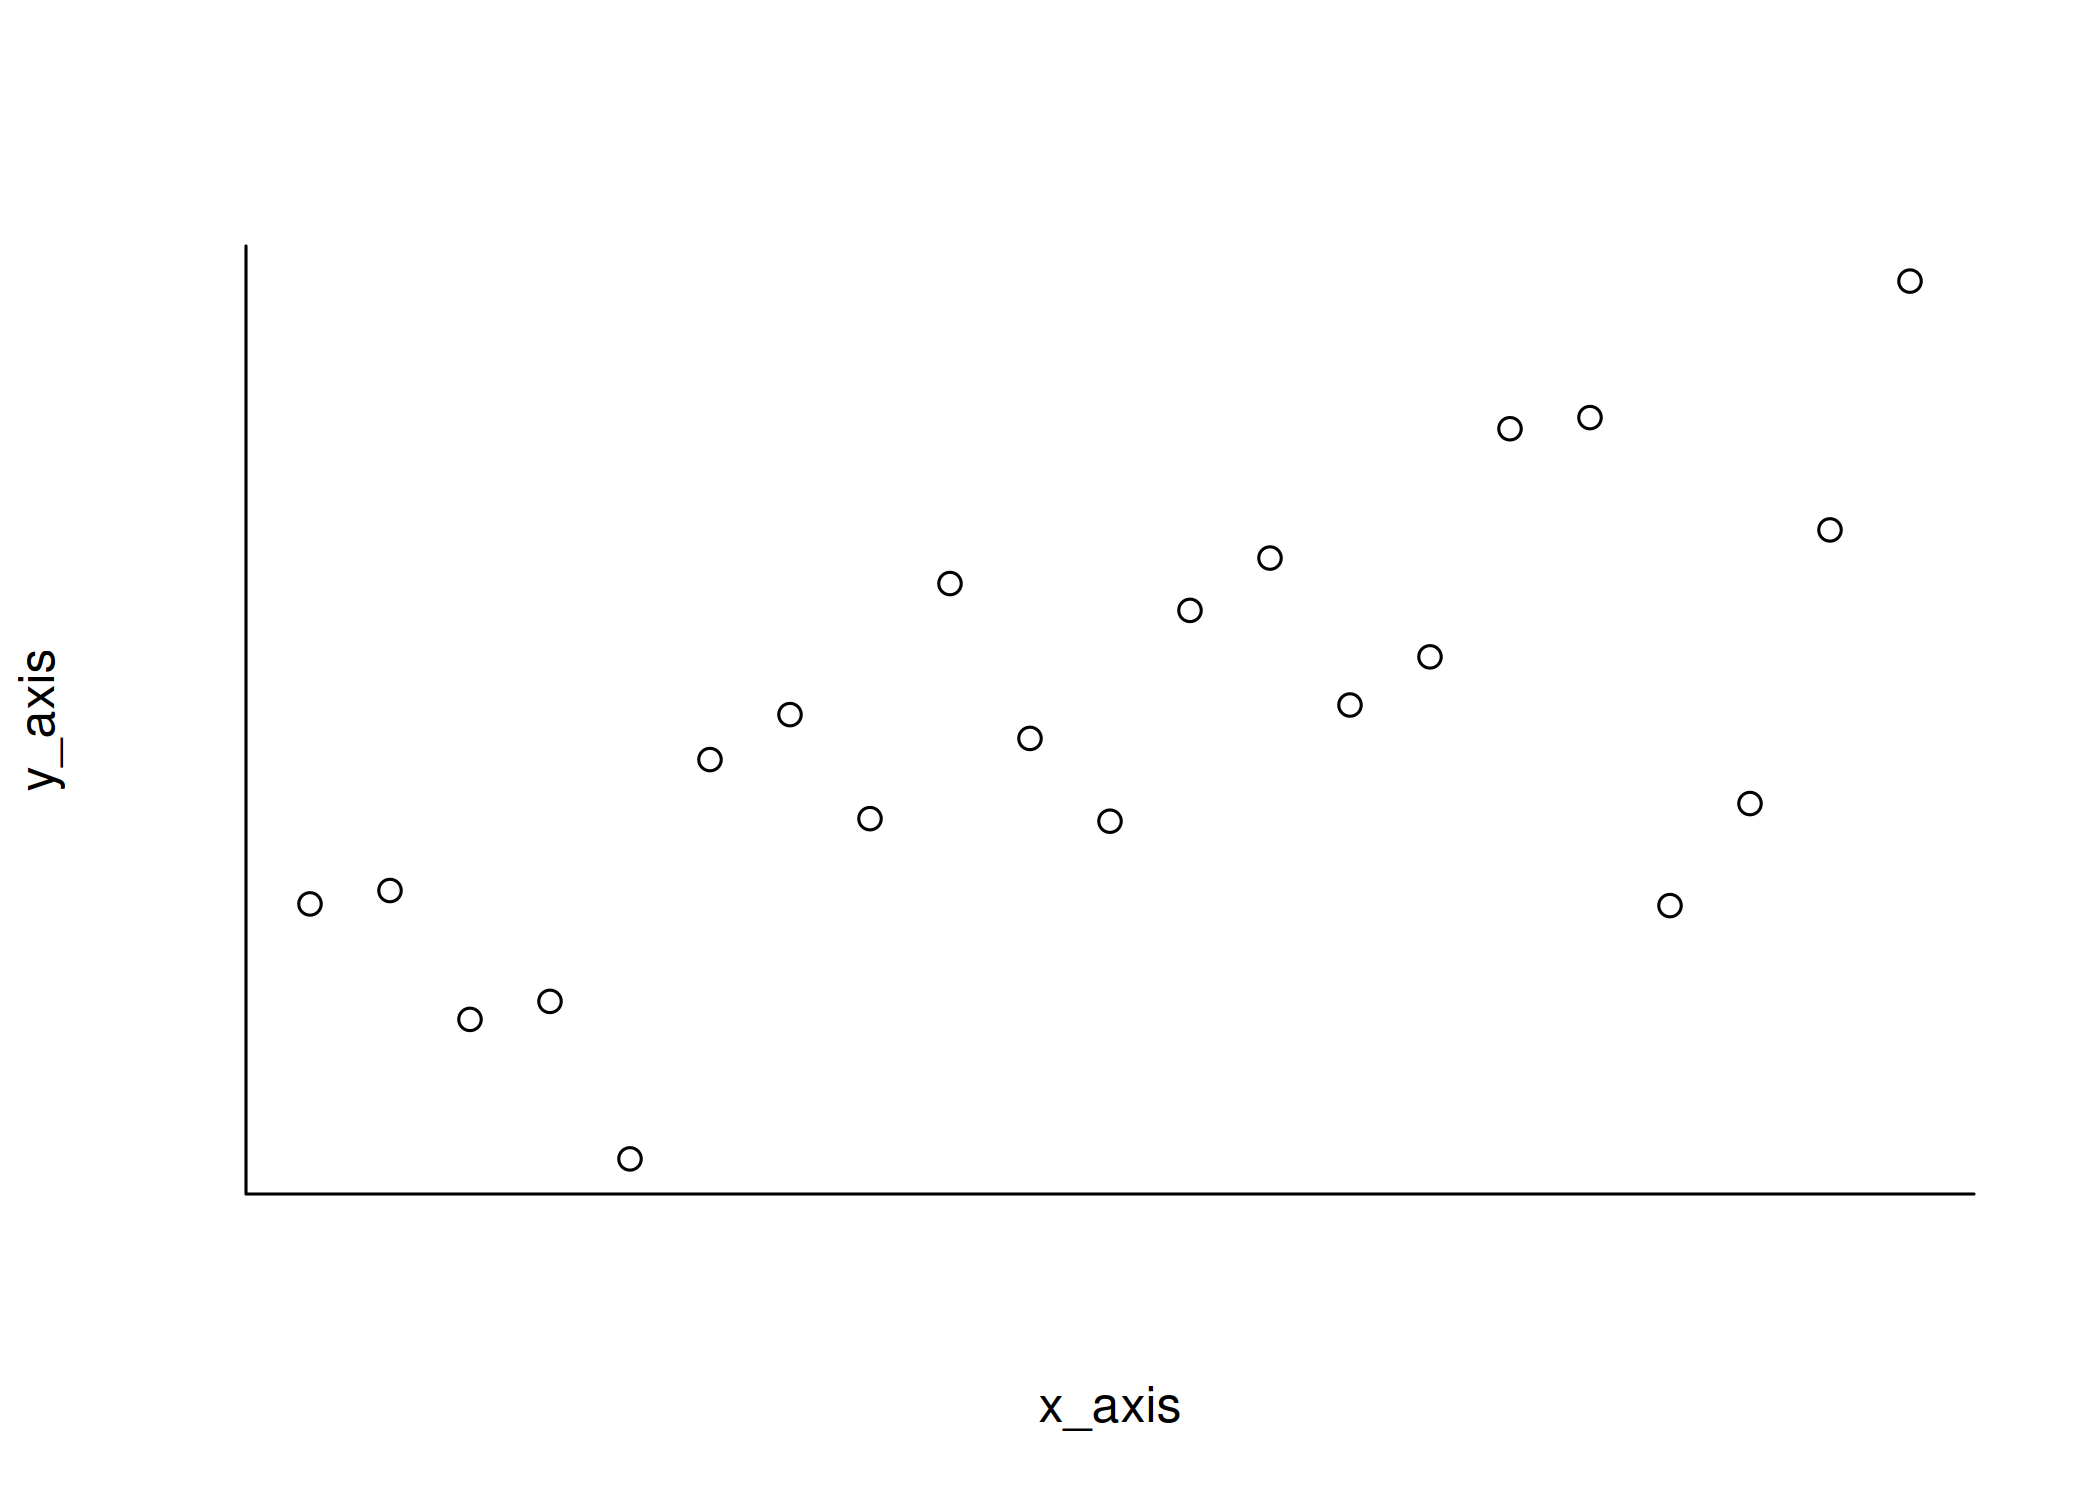
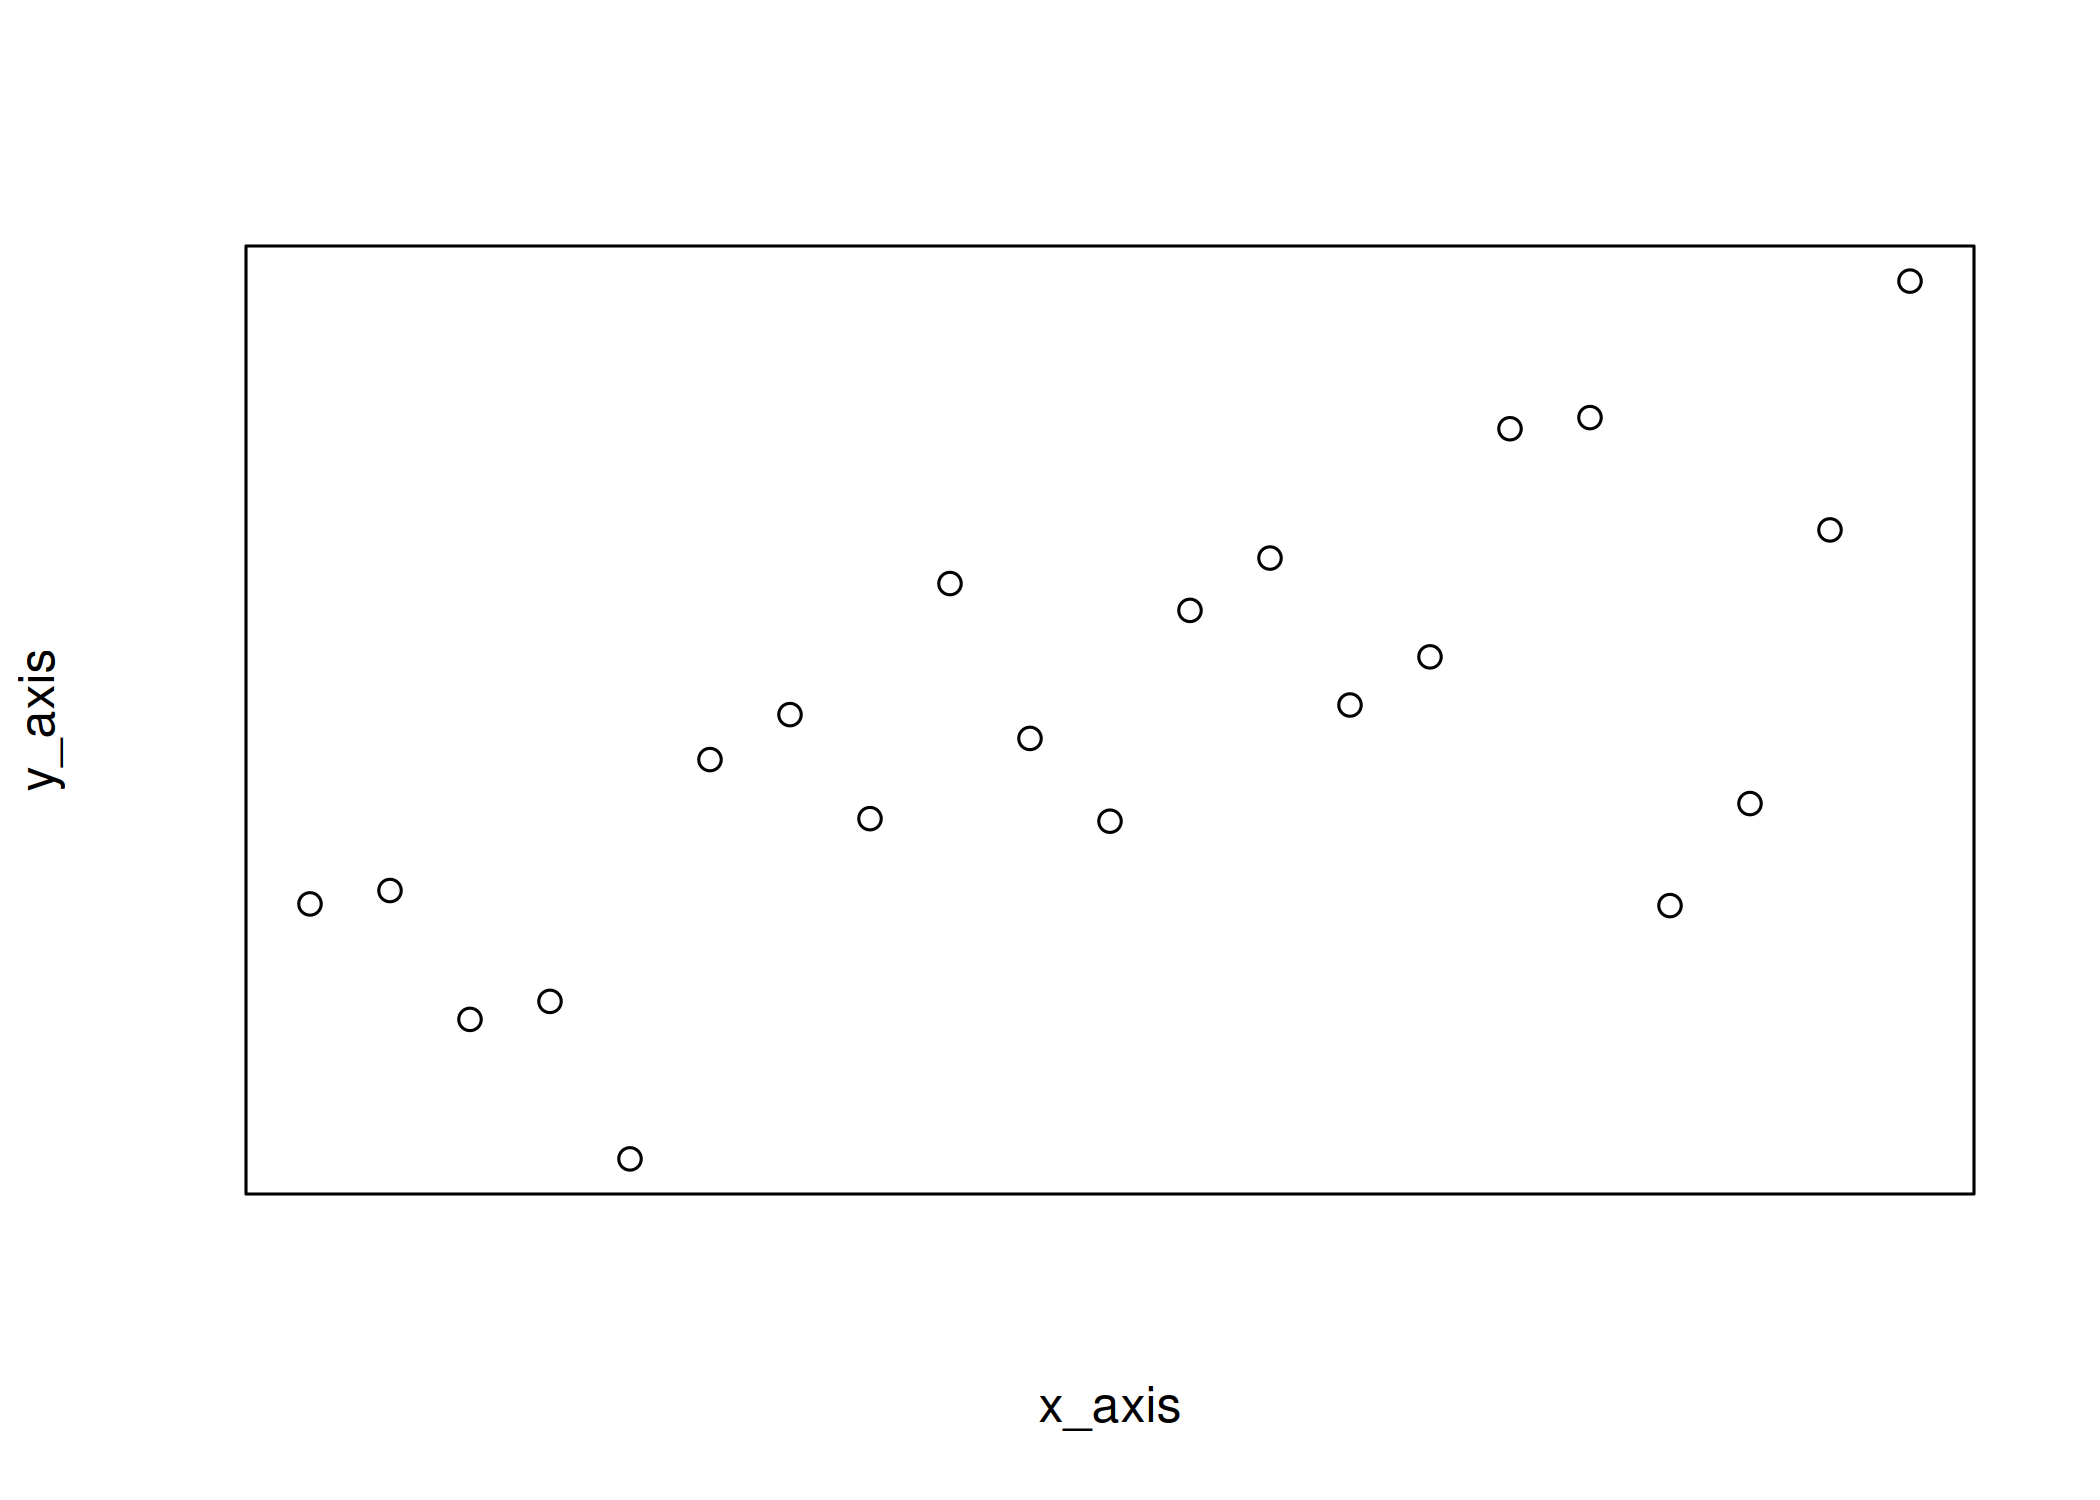
The second option is to set axes to FALSE in plot():
| |
As you can see, when axes = FALSE the box is also removed and you can
actually add it back with box():
| |

and change its style, if desired:
| |
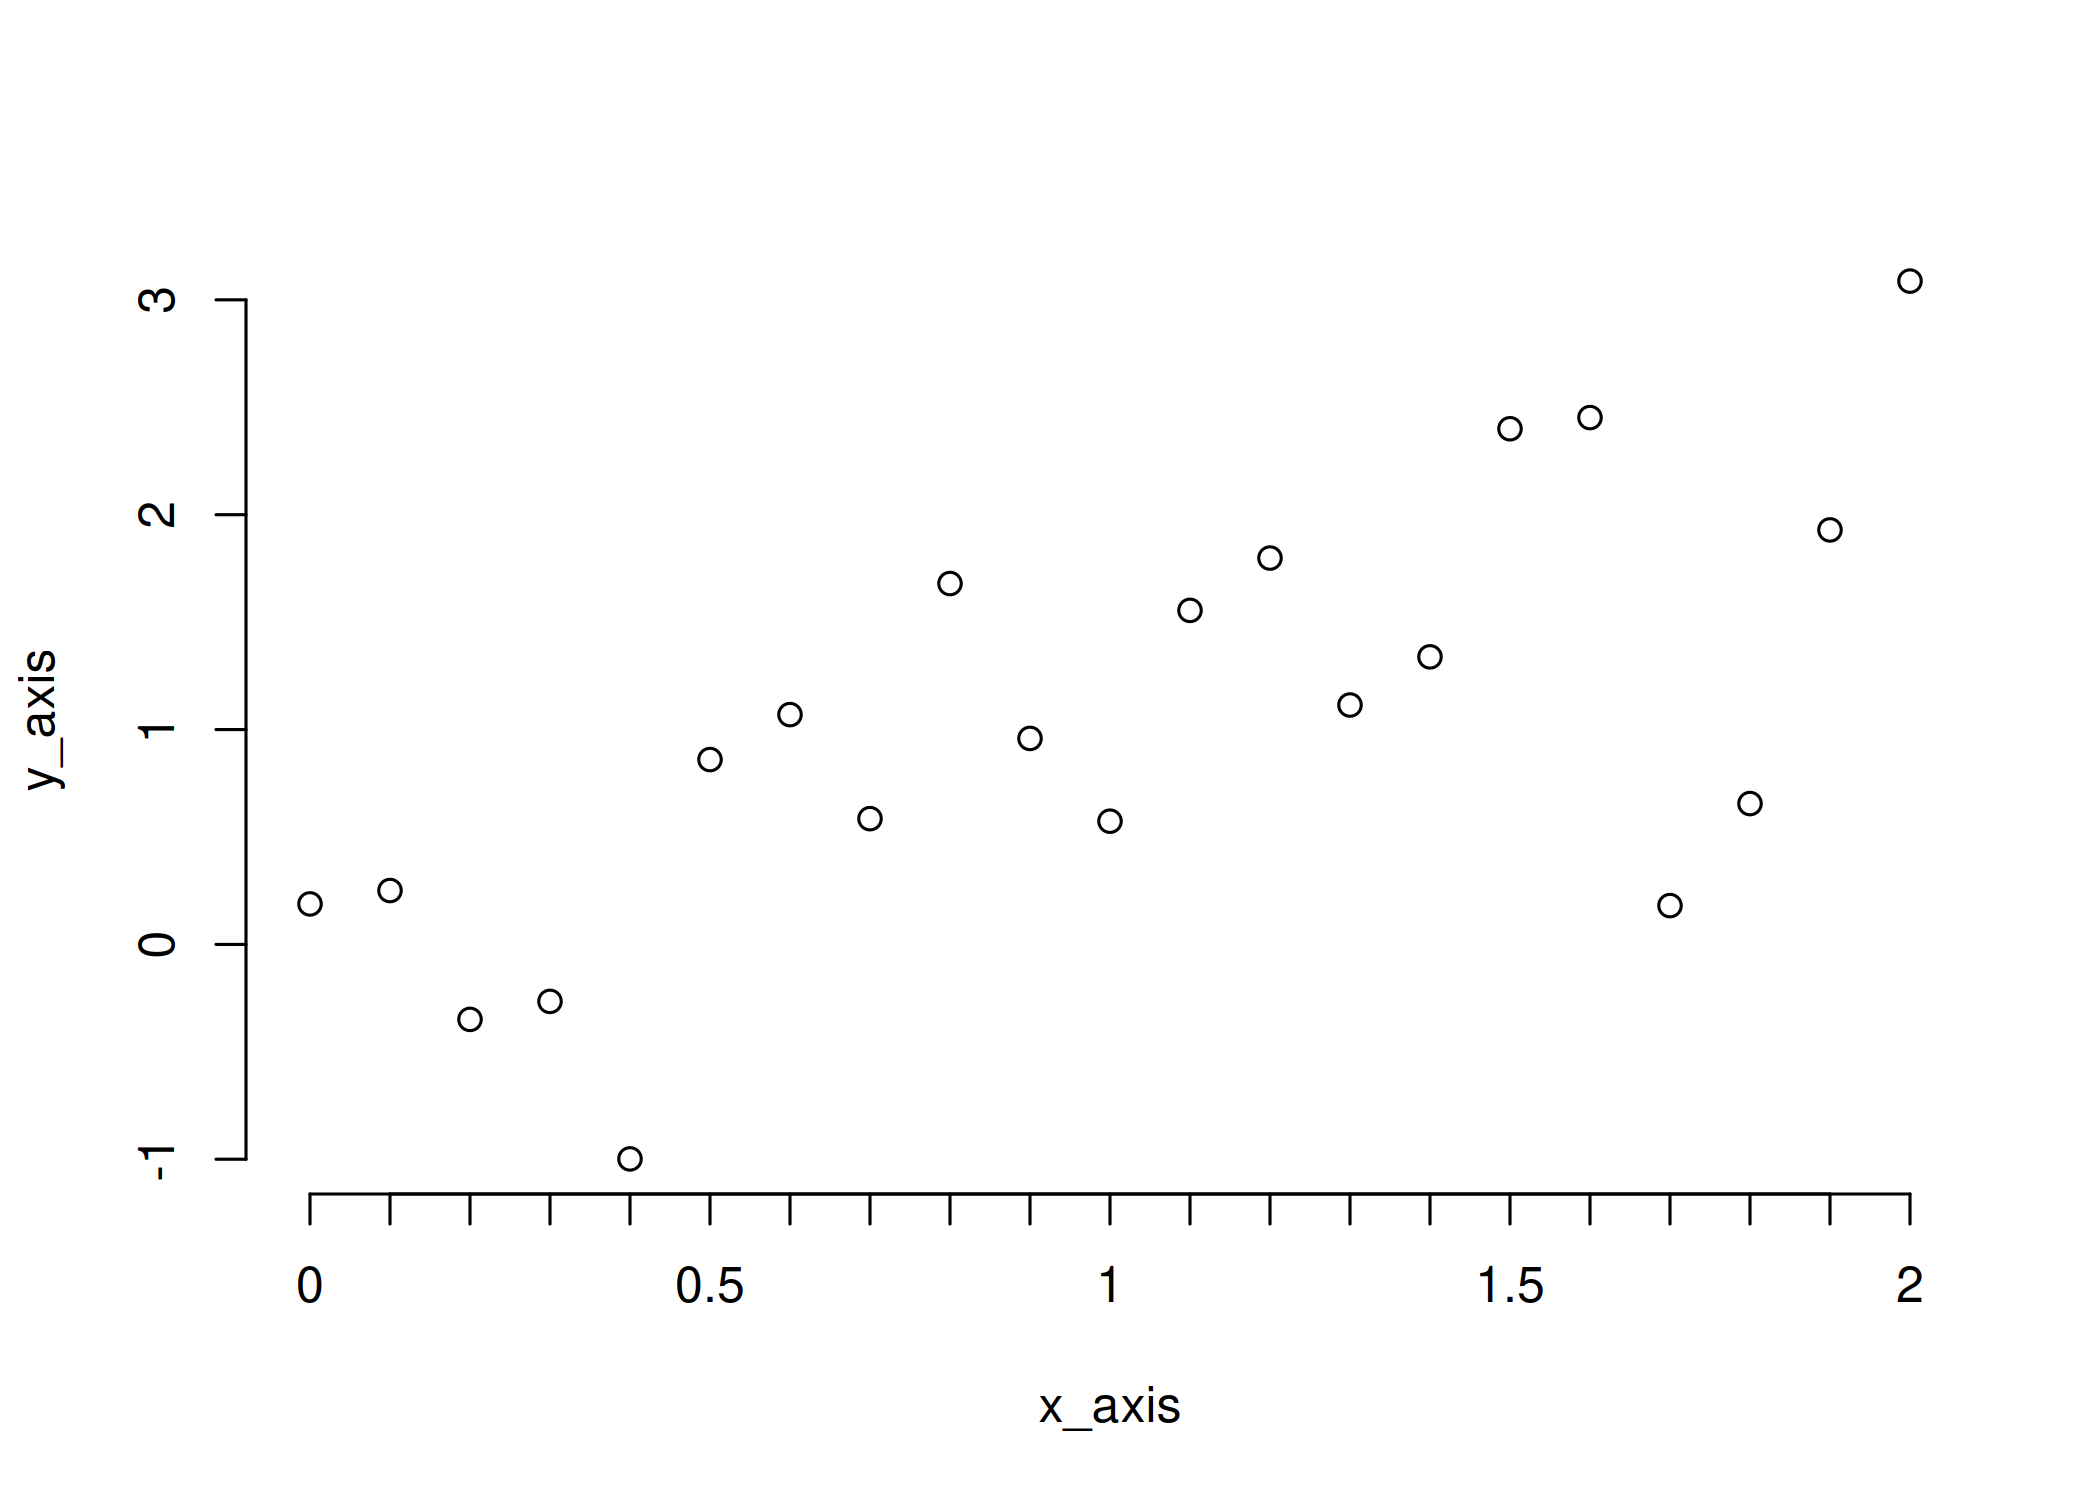
That being said, let’s only remove the x-axis for the moment and add
ticks at 0, 0.5, 1, 1.5 and 2 to the x-axis using axis():
| |
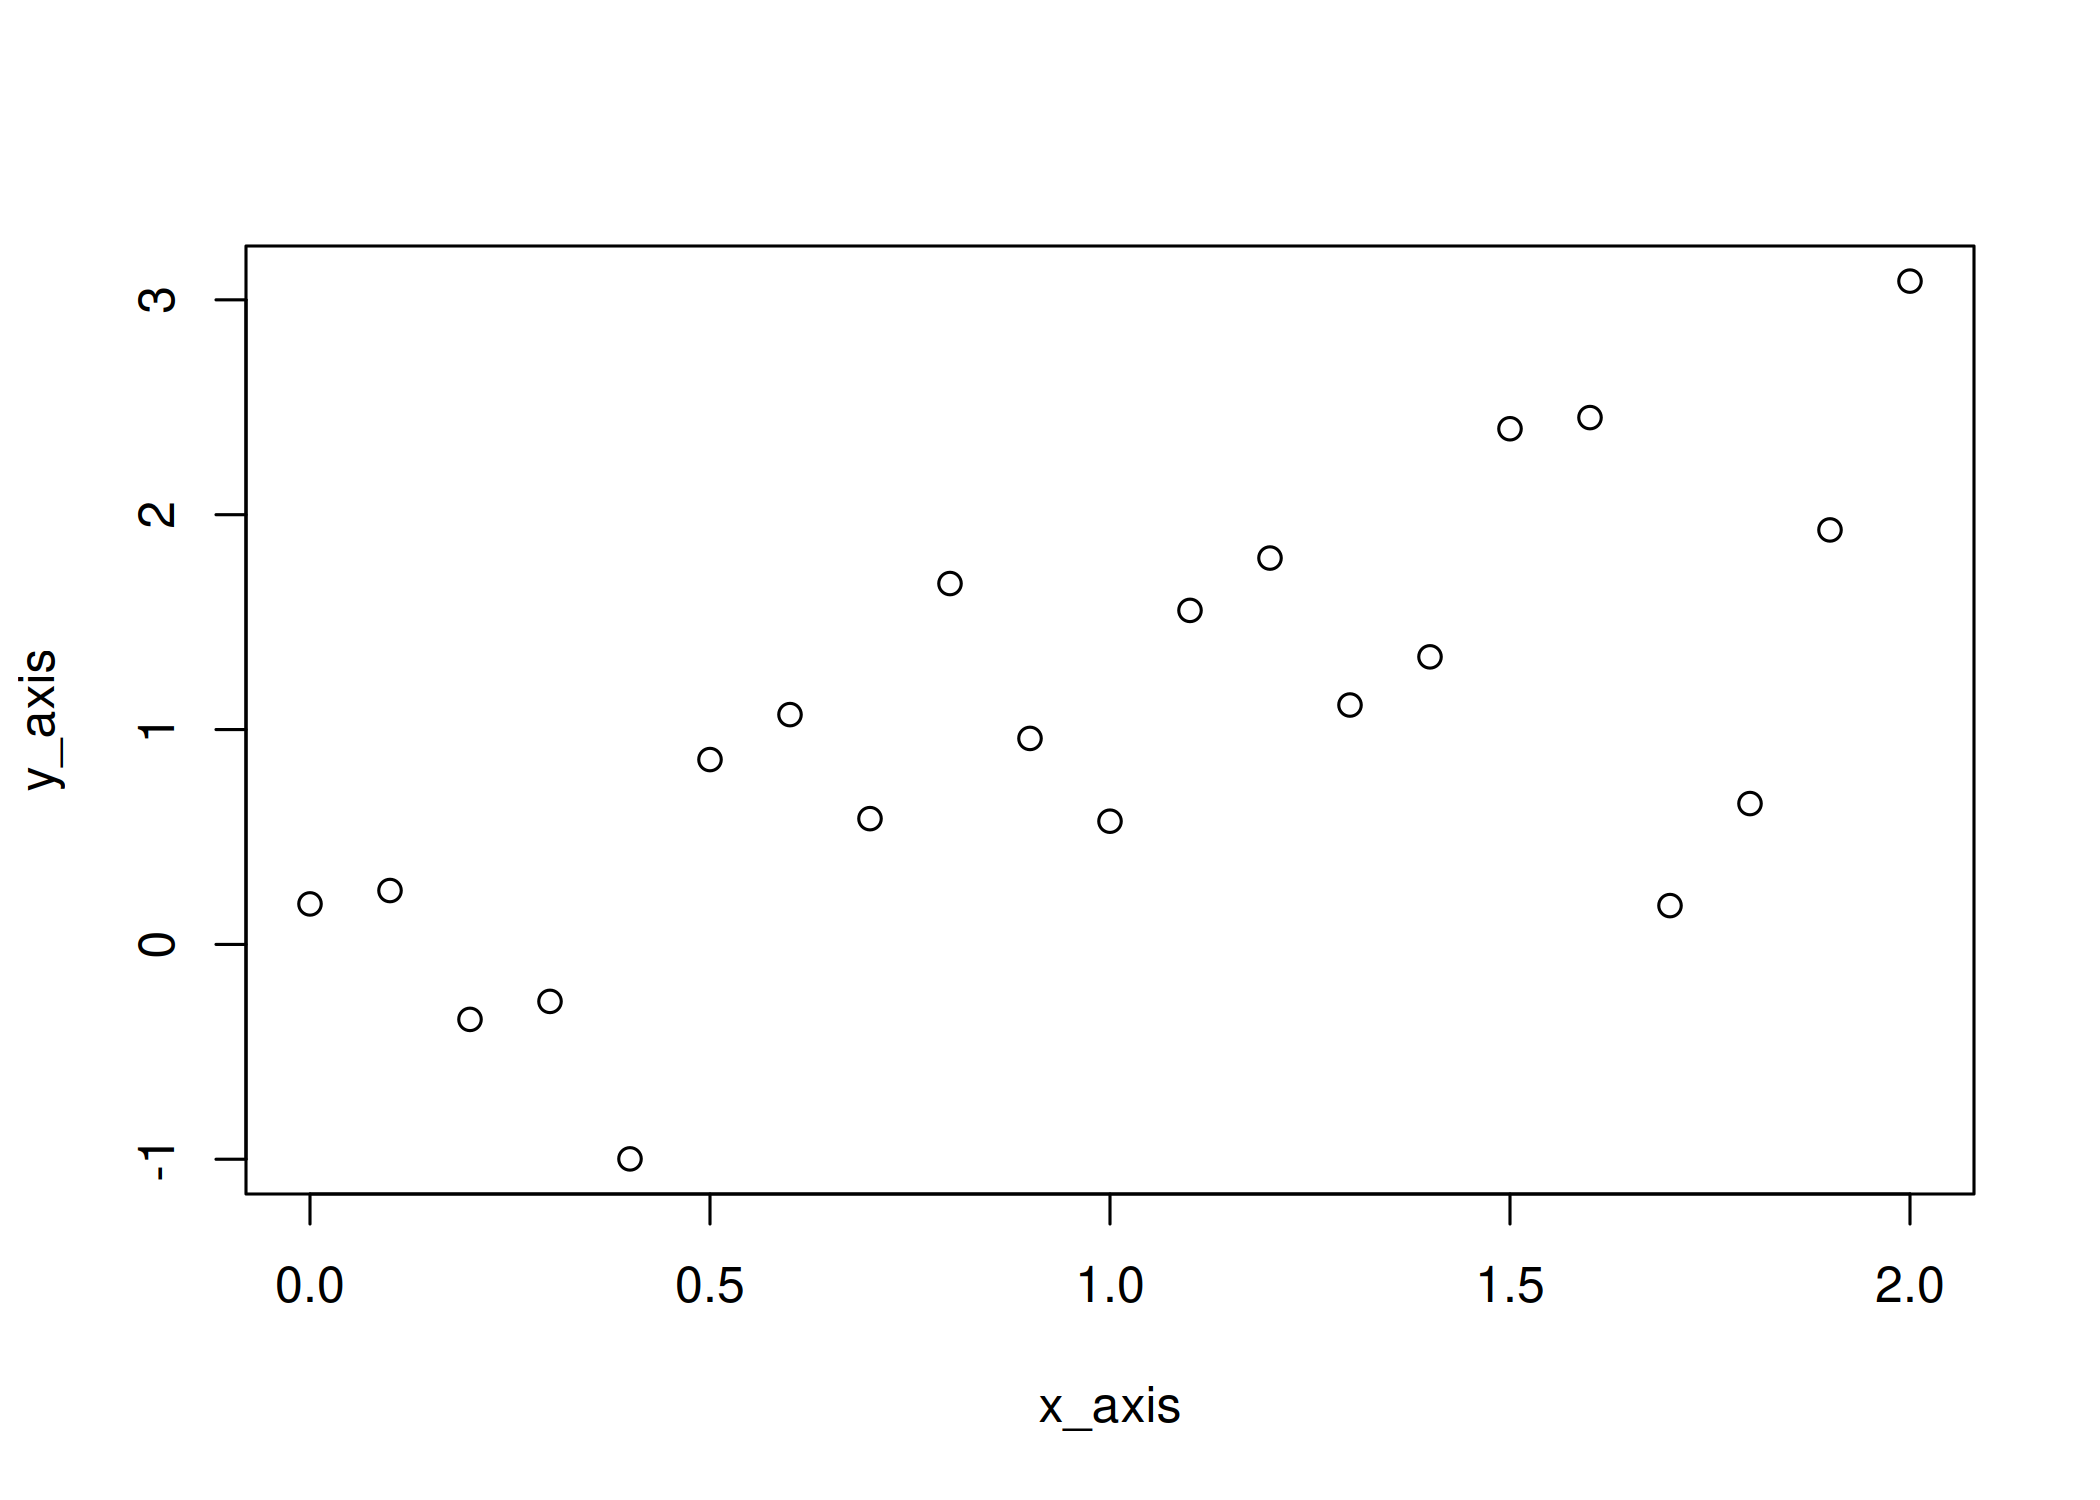
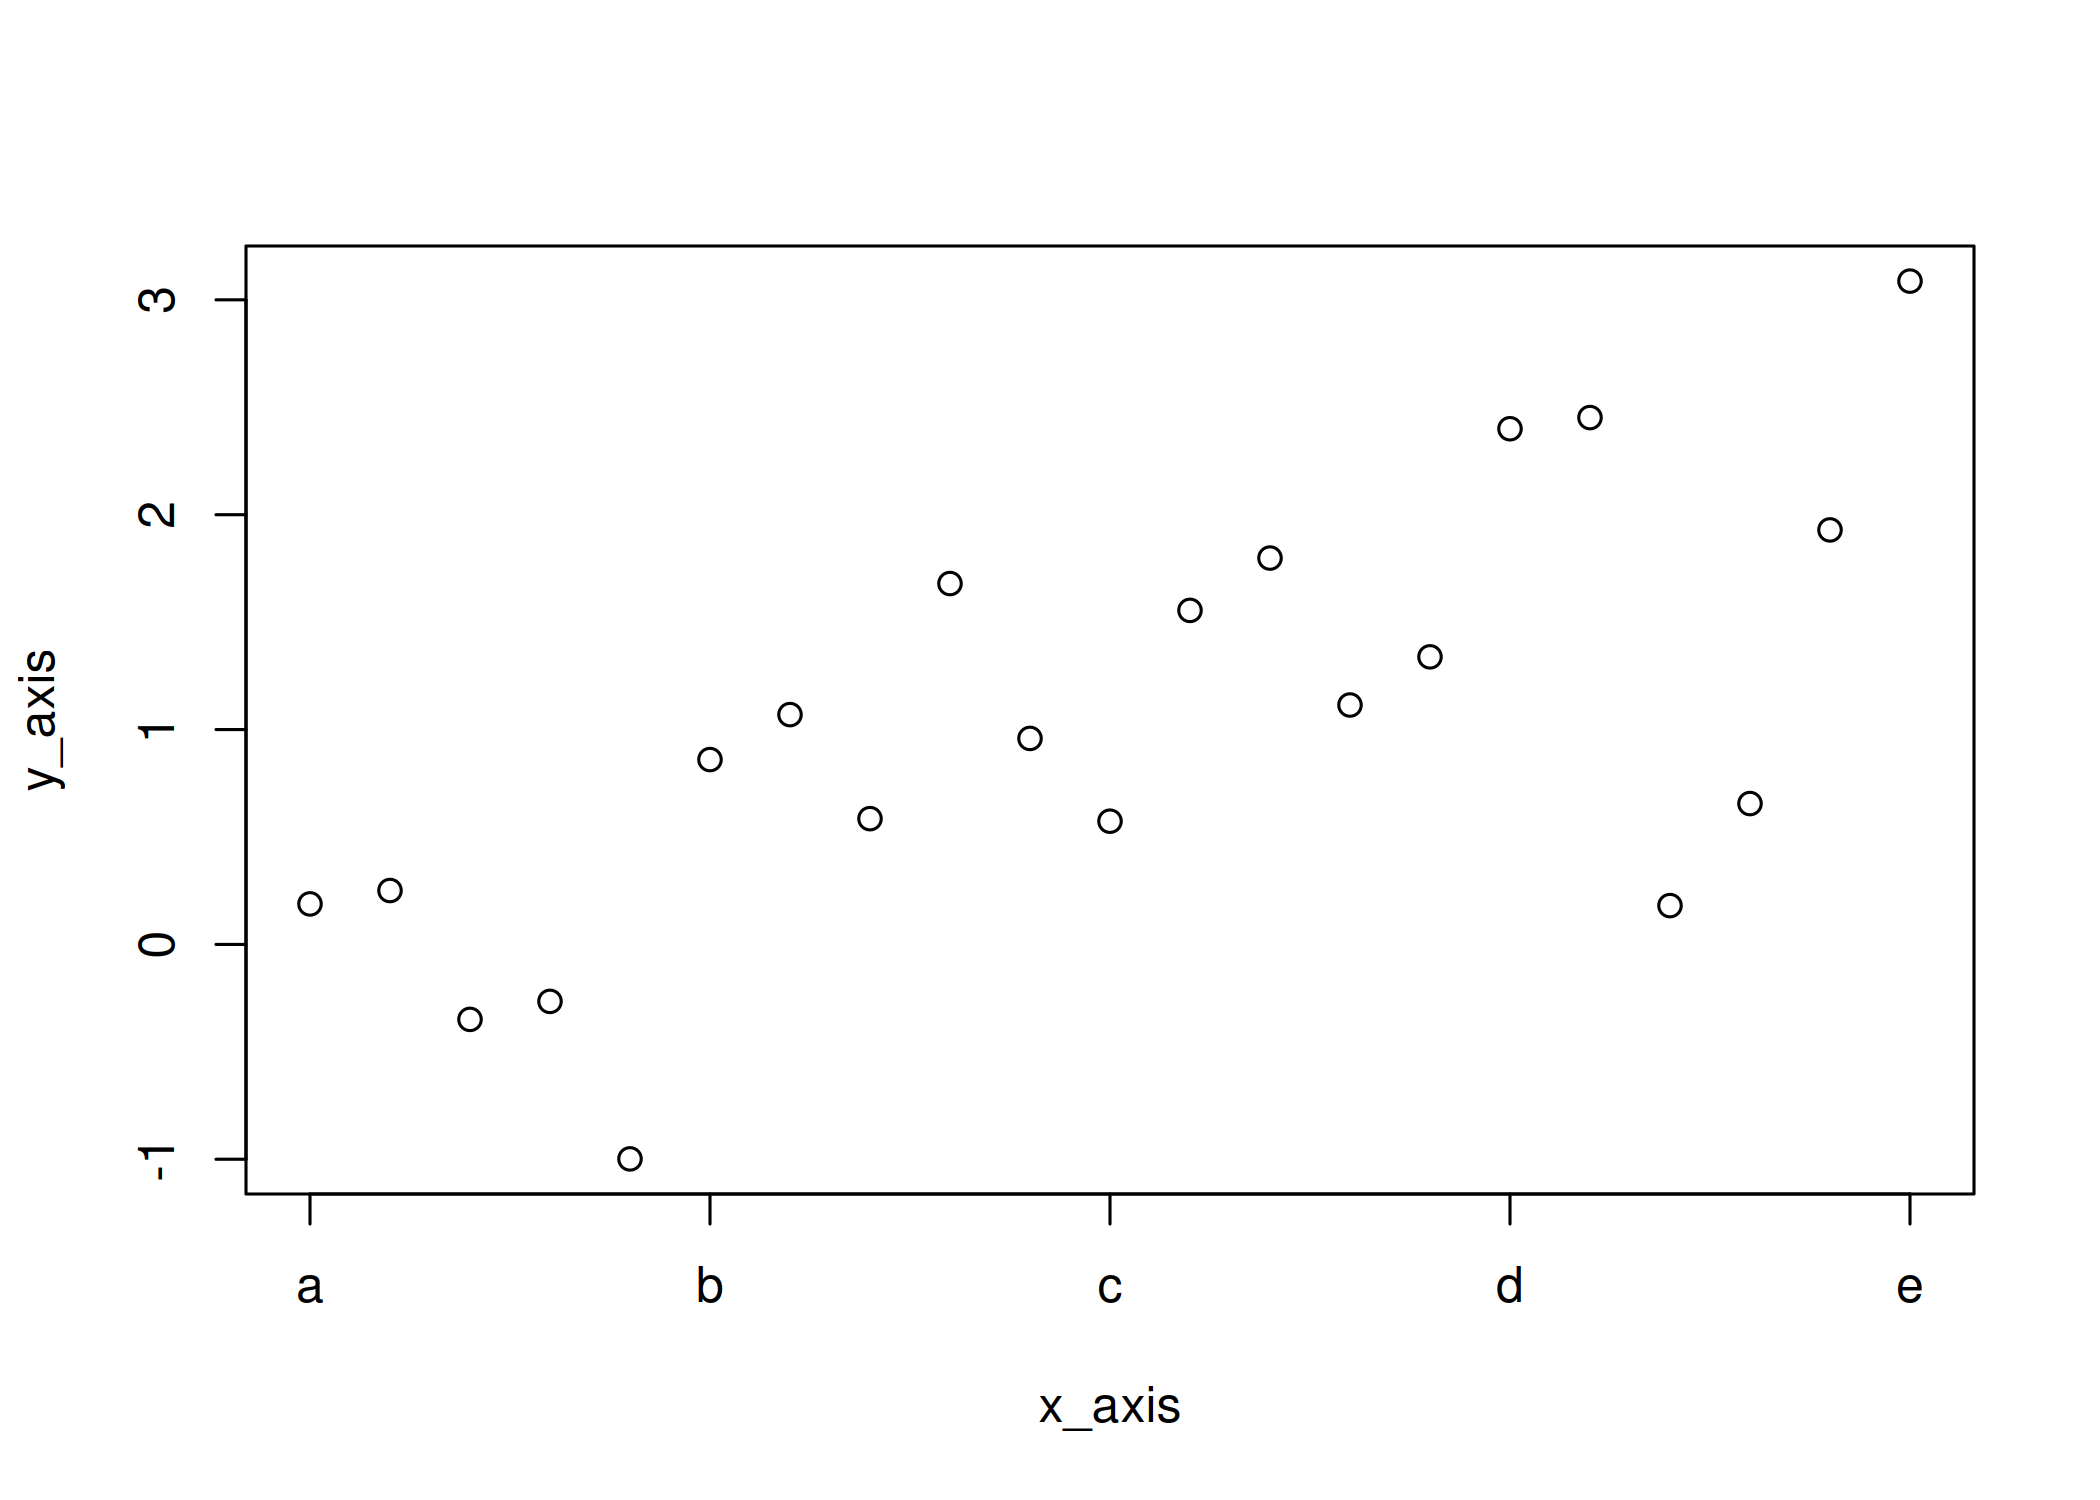
I can easily change the labels if values on the axis are not the ones that should be displayed, e.g.
| |
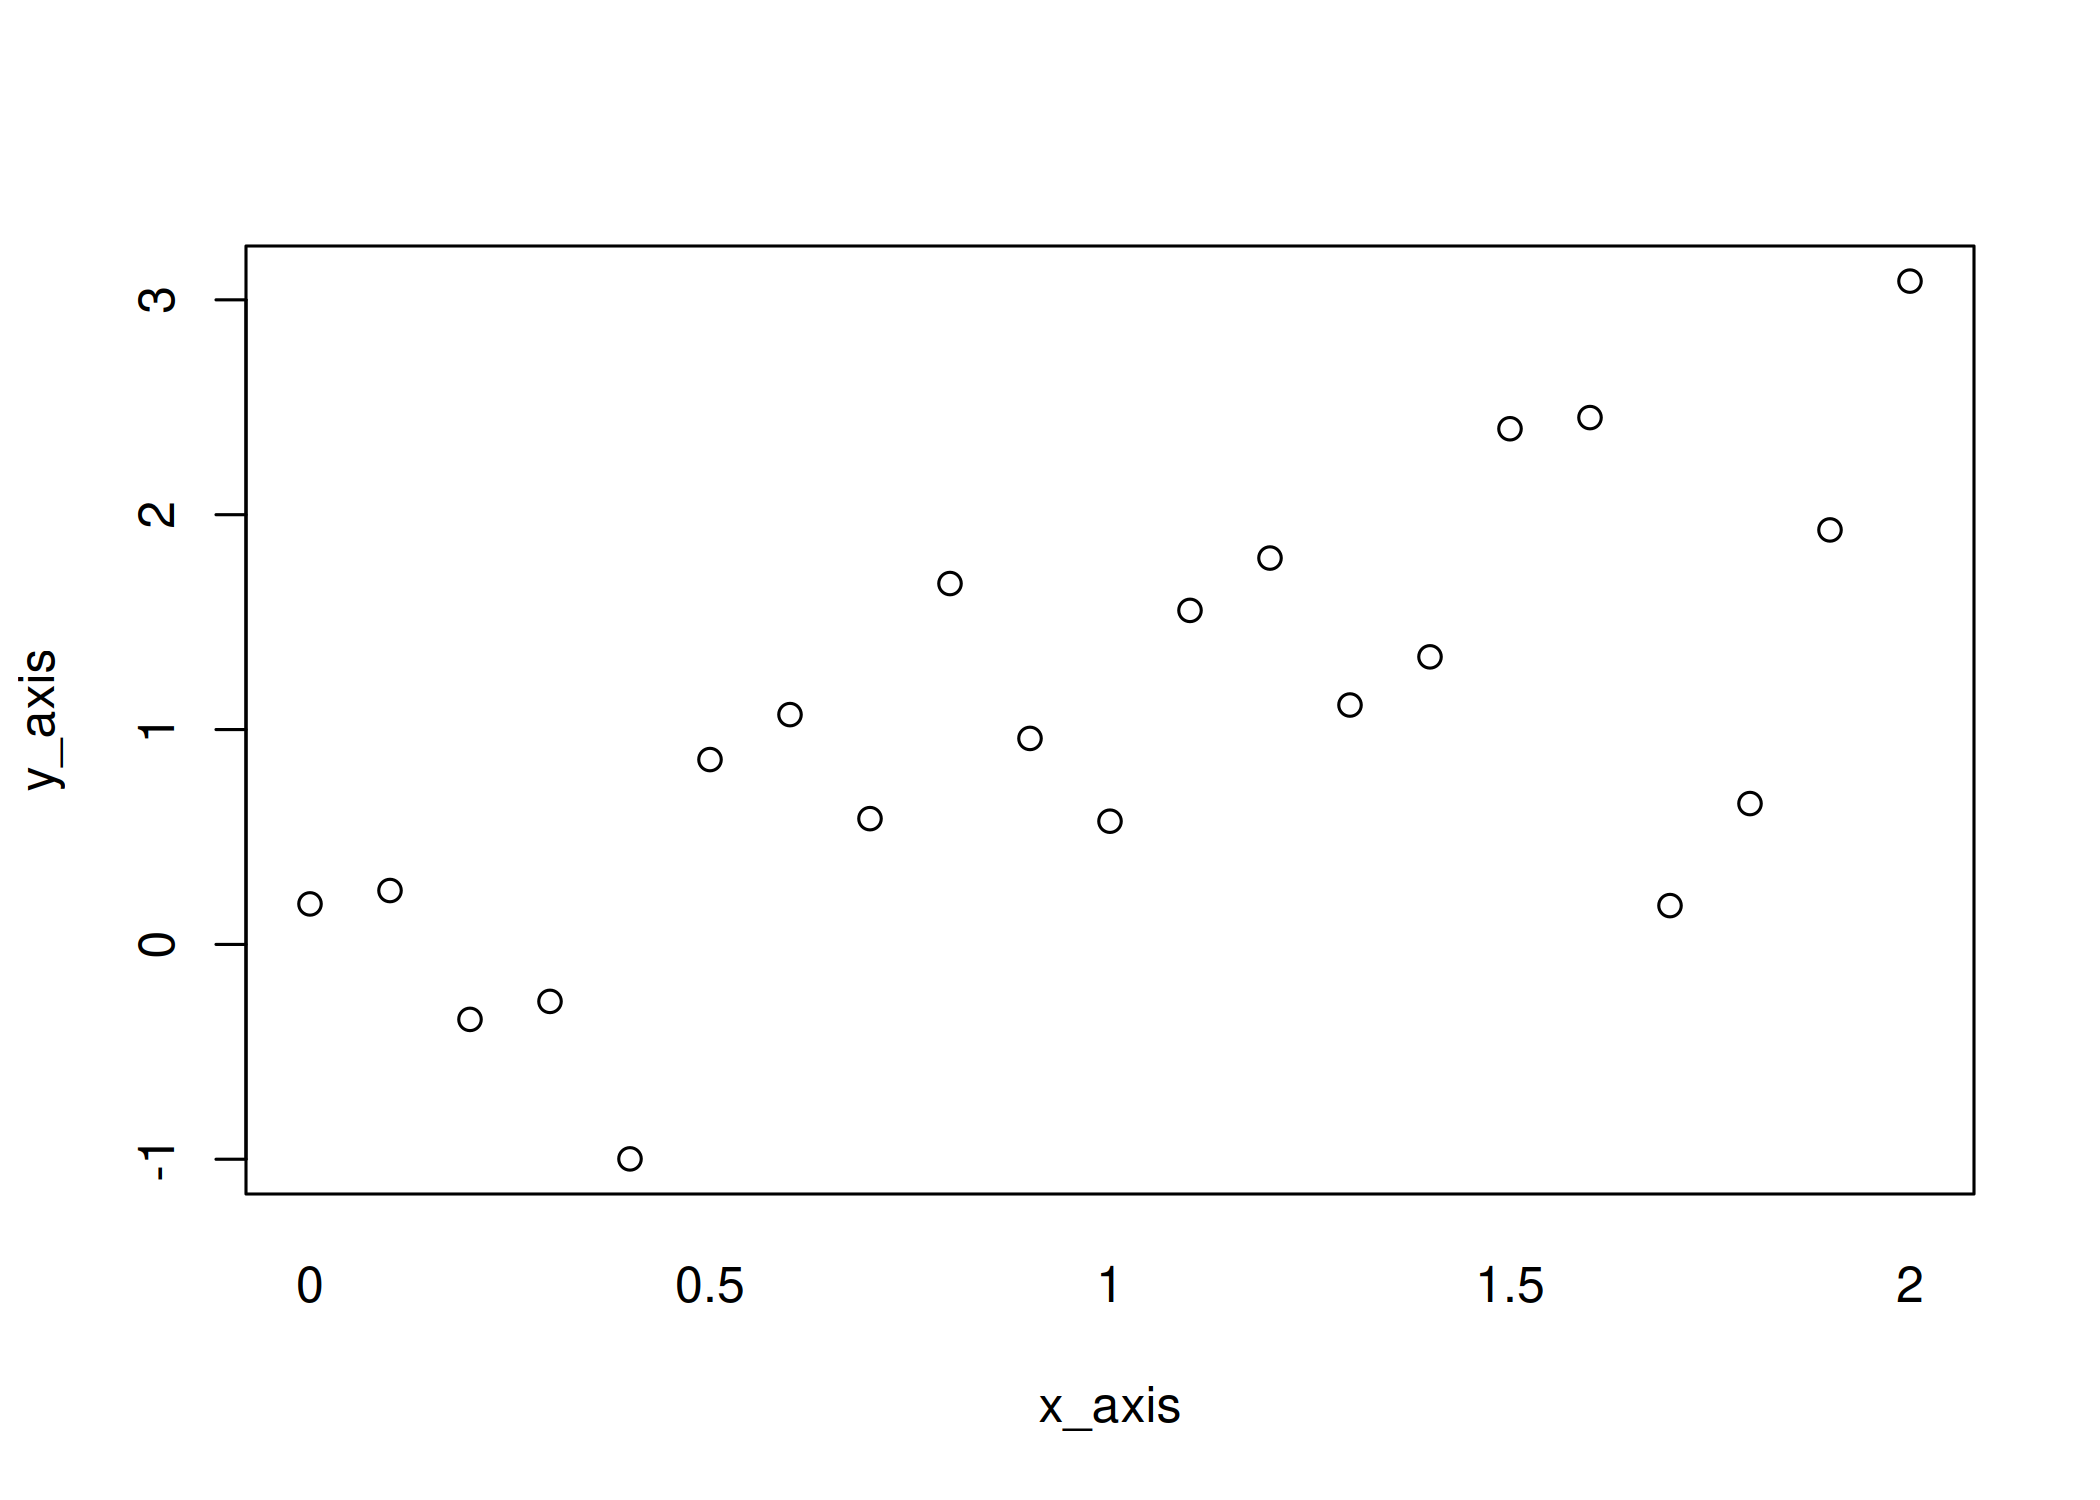
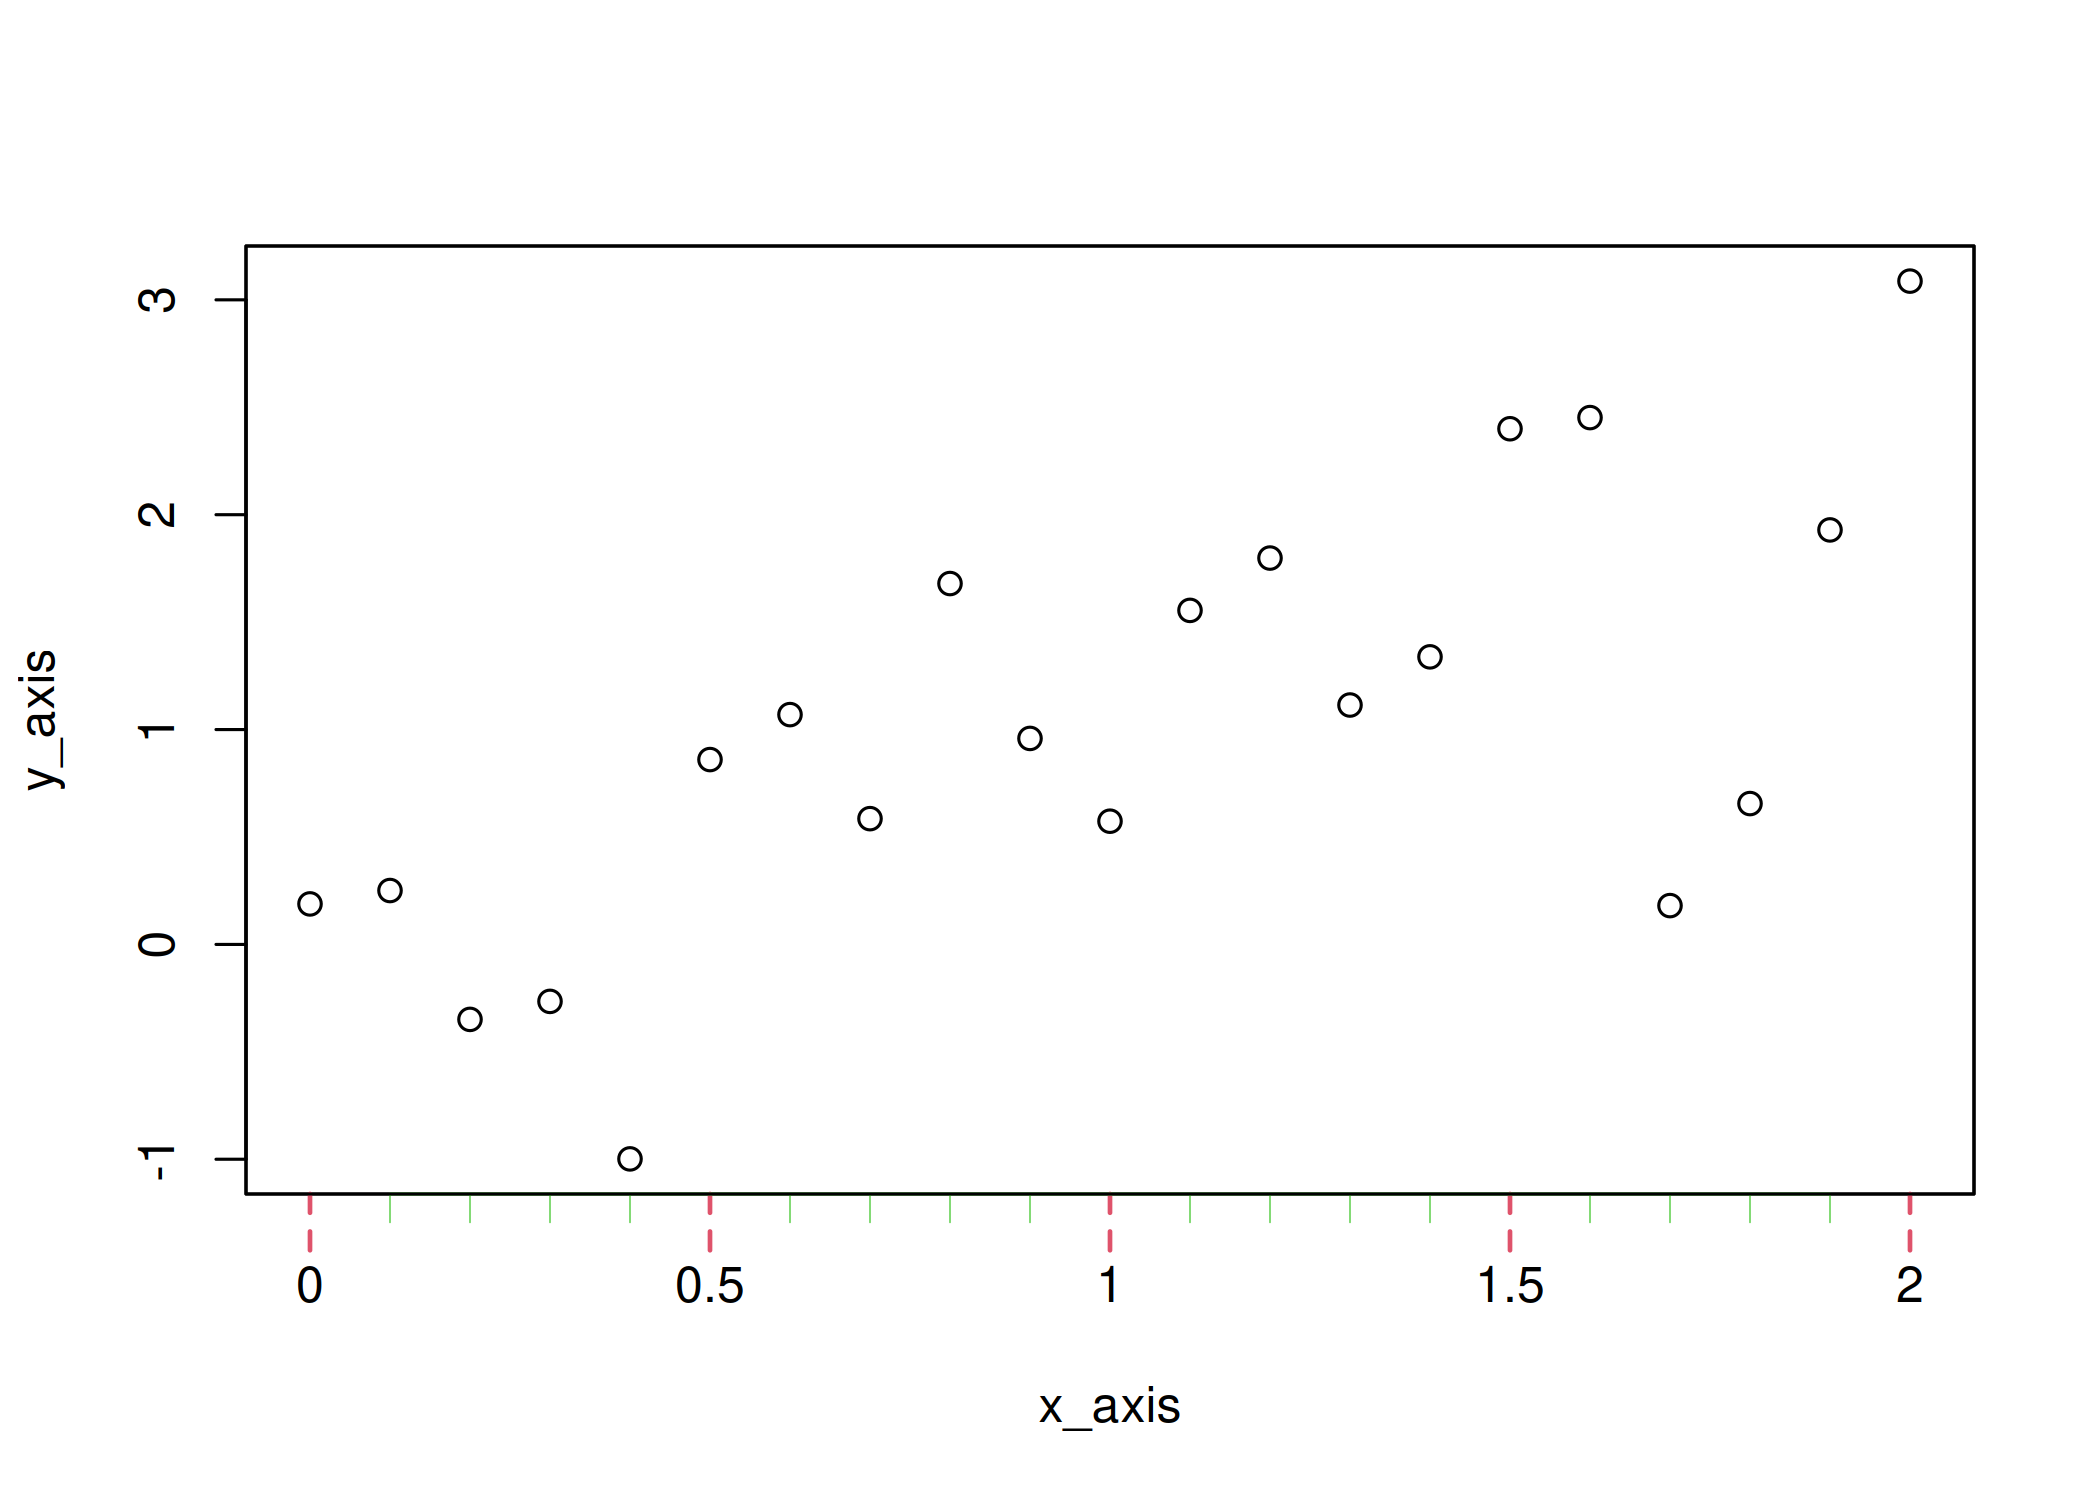
Second set of tick marks
Now, let’s add a second set of tick marks! This can be done by calling
axis() one more time.
| |
As you may have noticed, I use setdiff() to select the complementary
set of ticks. The approach is straightforward: define all tick positions
with seq() (here with a 0.1 step), define the main ticks, and use
setdiff() to get the remaining positions. Since these minor ticks
don’t need labels, I set labels = NA.
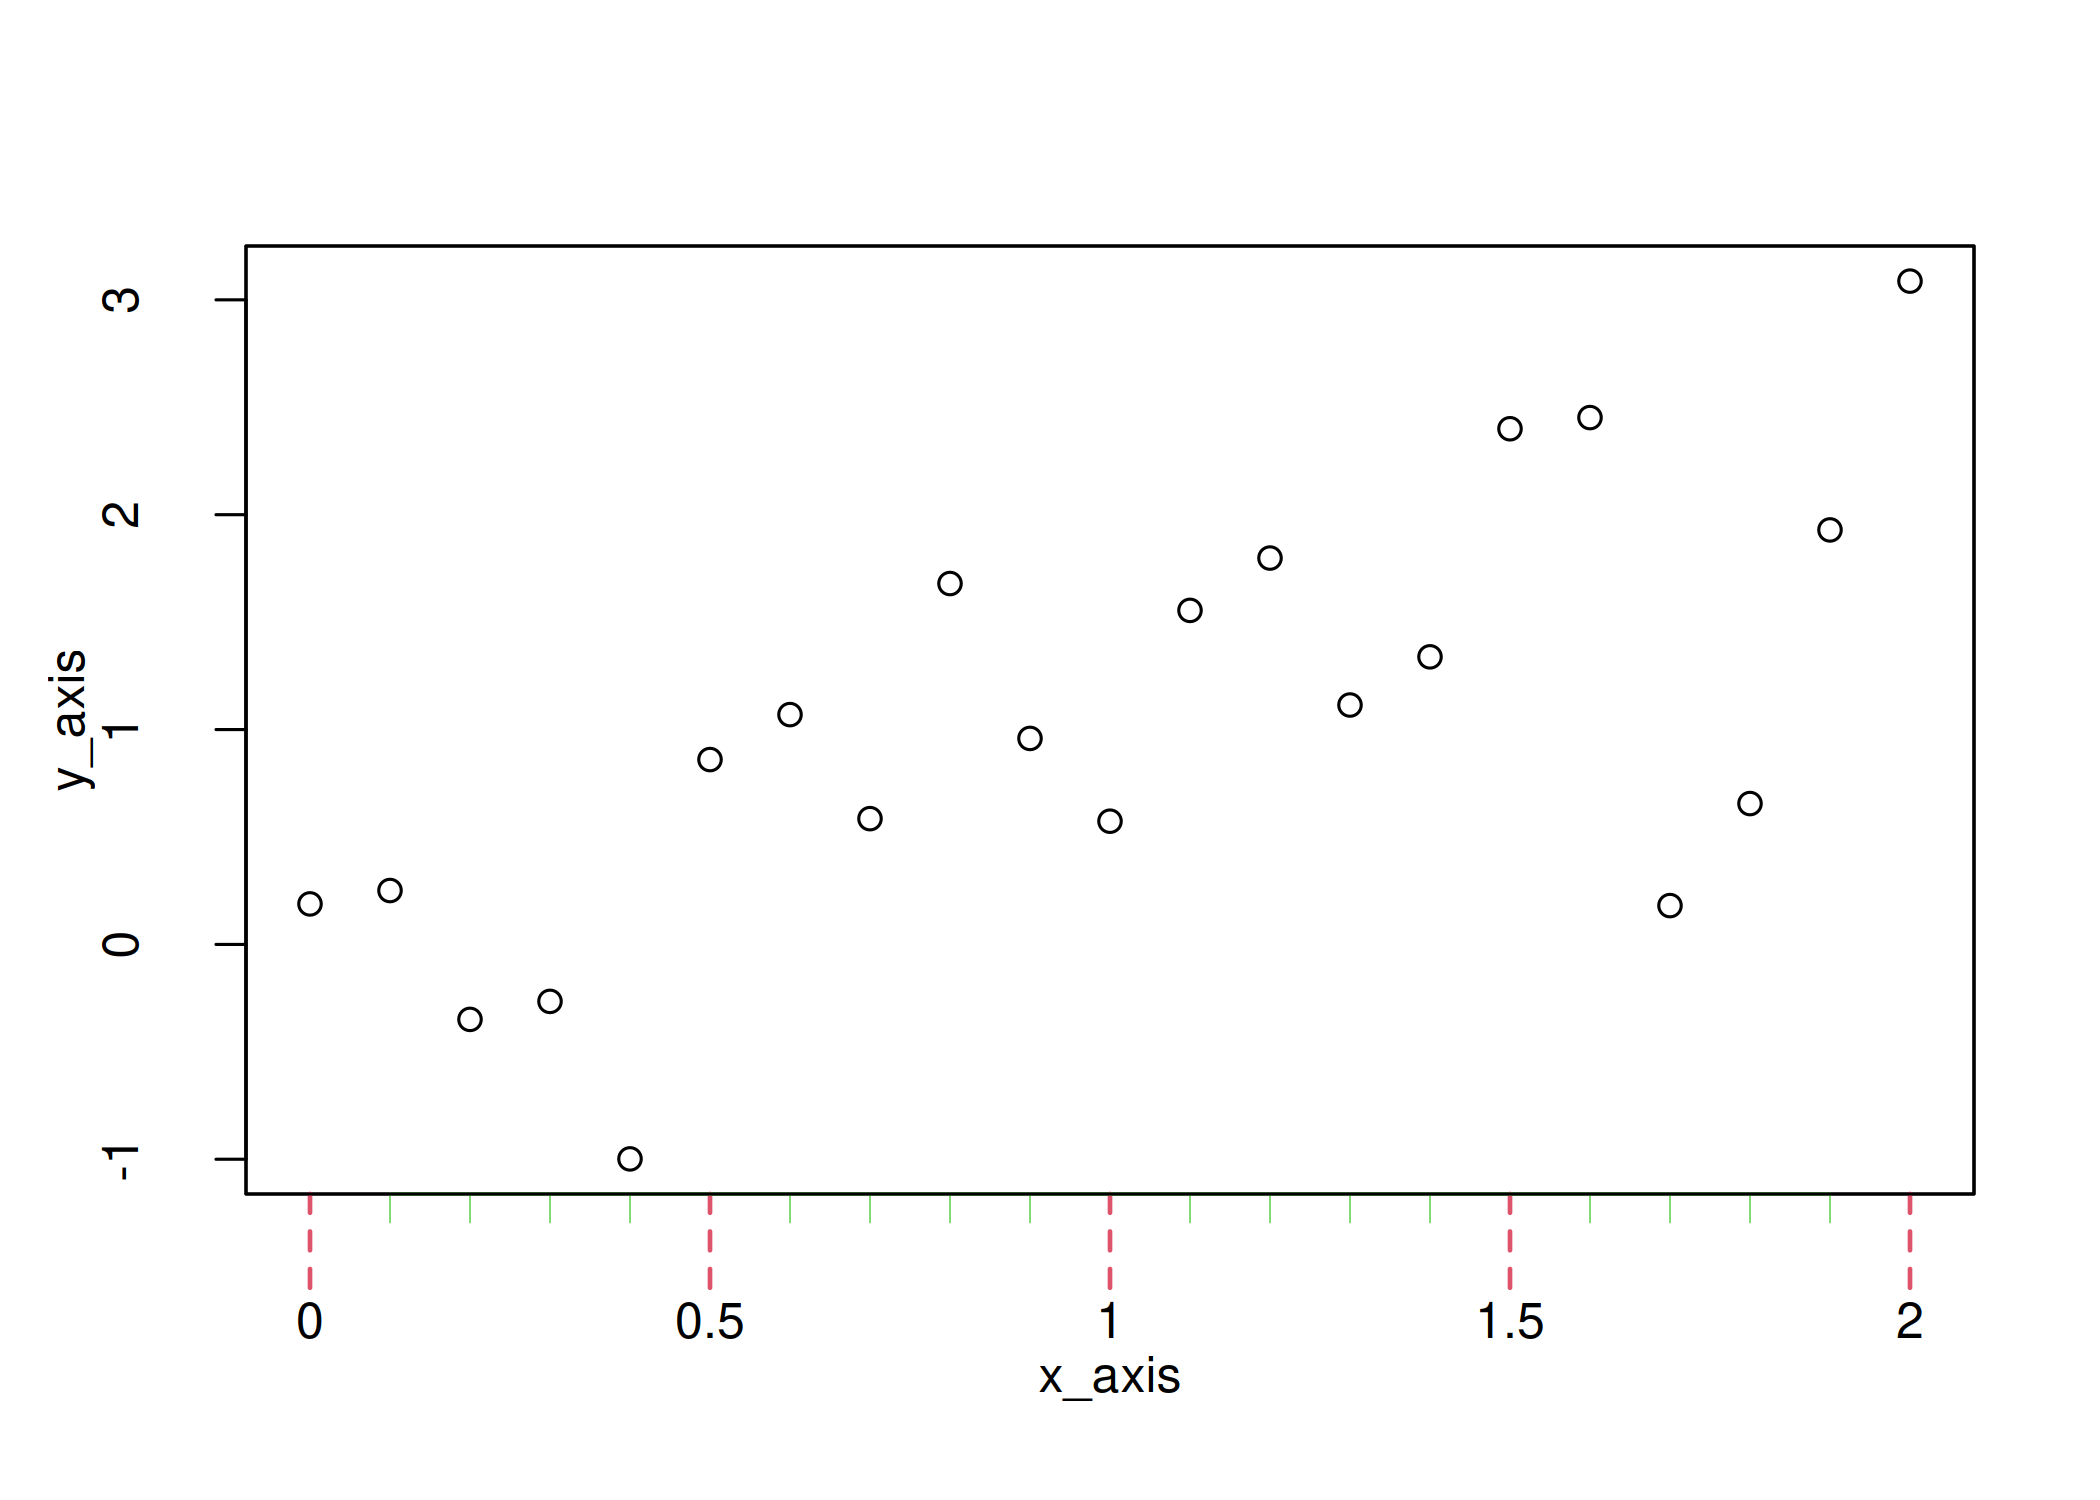
Remove the extra line
The main reason why I adjust the tick marks on my plots is to avoid
overlapping lines. Both axis() and box() draw lines that partially
overlap — this is also true with the default behaviour of plot(). The
lines that come along with the ticks
| |
overlap with the box
| |
This may frequently go unnoticed, but I personally tend to notice such
overlaps and it annoys me… Anyway, one way to handle this is to set the
line width to 0 in axis().
| |
and then to set the line width of the ticks, controlled by lwd.ticks,
to something greater than 0
| |

Note that if you only wish to remove the marks, you can use
tick = FALSE.
| |

But if you just want to get rid of the extra line, but not the ticks,
then you need to set lwd to 0 and lwd.ticks to a positive value.
Customize the ticks
Having done the steps above, you may have realized that fine-tuning
lwd.ticks is a good way to customize your tick marks!
| |

A second parameter to further customize the tick marks is tck, which
belongs to par()
| |
but can also be used with axis() thanks to the ellipsis (...), which
allows me to change it only for one set of ticks
| |
Moreover, using a positive value, you can make the ticks point inward!
| |
And finally you can change many aspects of them, including their color and line type:
| |
One more tip, if you need to adjust the position of the ticks you would
have to use mgp (also documented in par), which is a vector of three
elements controlling the following features:
- the position of the axis labels,
- the position of the tick labels,
- the position of the tick marks.
| |
Note that, just as for tck, I can use mgp in axis(). In this
example, it won’t affect the axis labels because they were added by
plot().
| |

Wrap all that up in a function
All the steps above may seem overwhelming at first. But once you get comfortable, you’ll realize that most plots require tweaking the same parameters, and you can wrap them in a function that covers your needs. For instance, I often use a function similar to the one below:
| |
which basically makes the customization of tick marks very easy!
| |
A note about ggplot2
You might be wondering why this article focuses on base graphics rather than ggplot2. Simply put, the topic is already well covered, for example:
- This article from the package documentation: Annotation log ticks
- This blog post from STHDA: ggplot2 axis ticks: a guide to customize tick marks and labels
Session Information
This provides the information under which the post was rendered.
| |
R version 4.5.2 (2025-10-31)
Platform: x86_64-pc-linux-gnu
Running under: Ubuntu 25.10

Matrix products: default
BLAS:   /usr/lib/x86_64-linux-gnu/blas/libblas.so.3.12.1
LAPACK: /usr/lib/x86_64-linux-gnu/lapack/liblapack.so.3.12.1;  LAPACK version 3.12.0

locale:
 [1] LC_CTYPE=en_US.UTF-8       LC_NUMERIC=C
 [3] LC_TIME=en_US.UTF-8        LC_COLLATE=en_US.UTF-8
 [5] LC_MONETARY=en_US.UTF-8    LC_MESSAGES=en_US.UTF-8
 [7] LC_PAPER=en_US.UTF-8       LC_NAME=C
 [9] LC_ADDRESS=C               LC_TELEPHONE=C
[11] LC_MEASUREMENT=en_US.UTF-8 LC_IDENTIFICATION=C

time zone: America/New_York
tzcode source: system (glibc)

attached base packages:
[1] stats     graphics  grDevices datasets  utils     methods   base

loaded via a namespace (and not attached):
 [1] vctrs_0.7.1         cli_3.6.5           knitr_1.51
 [4] rlang_1.1.7         xfun_0.56           otel_0.2.0
 [7] processx_3.8.6      targets_1.11.4      jsonlite_2.0.0
[10] data.table_1.18.2.1 glue_1.8.0          prettyunits_1.2.0
[13] backports_1.5.0     htmltools_0.5.9     ps_1.9.1
[16] rmarkdown_2.30      evaluate_1.0.5      tibble_3.3.1
[19] fastmap_1.2.0       base64url_1.4       yaml_2.3.12
[22] lifecycle_1.0.5     compiler_4.5.2      codetools_0.2-20
[25] igraph_2.2.1        pkgconfig_2.0.3     digest_0.6.39
[28] R6_2.6.1            tidyselect_1.2.1    pillar_1.11.1
[31] callr_3.7.6         magrittr_2.0.4      tools_4.5.2
[34] secretbase_1.1.1    bspm_0.5.7
Have a topic in mind or want to stay up to date with our work?
Let us know!